Immigrants from Eastern Africa vs Spanish Median Household Income
COMPARE
Immigrants from Eastern Africa
Spanish
Median Household Income
Median Household Income Comparison
Immigrants from Eastern Africa
Spanish
$84,299
MEDIAN HOUSEHOLD INCOME
37.4/ 100
METRIC RATING
184th/ 347
METRIC RANK
$83,343
MEDIAN HOUSEHOLD INCOME
24.4/ 100
METRIC RATING
201st/ 347
METRIC RANK
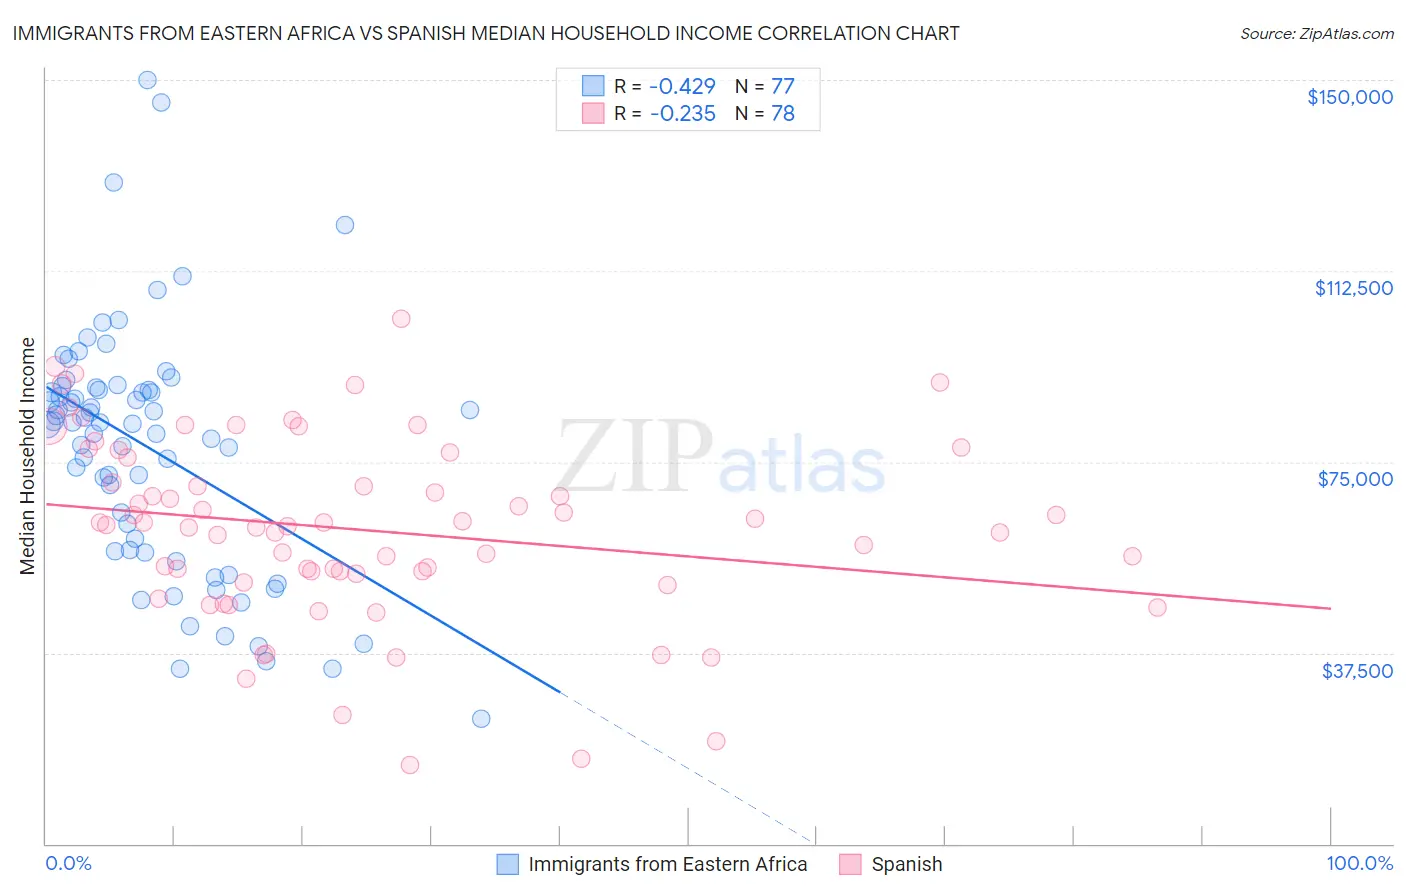
Immigrants from Eastern Africa vs Spanish Median Household Income Correlation Chart
The statistical analysis conducted on geographies consisting of 354,838,071 people shows a moderate negative correlation between the proportion of Immigrants from Eastern Africa and median household income in the United States with a correlation coefficient (R) of -0.429 and weighted average of $84,299. Similarly, the statistical analysis conducted on geographies consisting of 421,807,066 people shows a weak negative correlation between the proportion of Spanish and median household income in the United States with a correlation coefficient (R) of -0.235 and weighted average of $83,343, a difference of 1.1%.
Median Household Income Correlation Summary
| Measurement | Immigrants from Eastern Africa | Spanish |
| Minimum | $24,660 | $15,577 |
| Maximum | $149,957 | $103,194 |
| Range | $125,297 | $87,617 |
| Mean | $77,695 | $61,640 |
| Median | $82,646 | $62,411 |
| Interquartile 25% (IQ1) | $57,630 | $53,047 |
| Interquartile 75% (IQ3) | $89,428 | $75,942 |
| Interquartile Range (IQR) | $31,798 | $22,895 |
| Standard Deviation (Sample) | $24,325 | $18,137 |
| Standard Deviation (Population) | $24,166 | $18,021 |
Demographics Similar to Immigrants from Eastern Africa and Spanish by Median Household Income
In terms of median household income, the demographic groups most similar to Immigrants from Eastern Africa are Kenyan ($84,085, a difference of 0.25%), Puget Sound Salish ($84,011, a difference of 0.34%), Belgian ($84,008, a difference of 0.35%), Tlingit-Haida ($83,968, a difference of 0.39%), and Spaniard ($84,644, a difference of 0.41%). Similarly, the demographic groups most similar to Spanish are Tsimshian ($83,346, a difference of 0.0%), German ($83,358, a difference of 0.020%), Immigrants from Thailand ($83,327, a difference of 0.020%), Japanese ($83,395, a difference of 0.060%), and Aleut ($83,446, a difference of 0.12%).
| Demographics | Rating | Rank | Median Household Income |
| Uruguayans | 43.5 /100 | #182 | Average $84,691 |
| Spaniards | 42.7 /100 | #183 | Average $84,644 |
| Immigrants | Eastern Africa | 37.4 /100 | #184 | Fair $84,299 |
| Kenyans | 34.2 /100 | #185 | Fair $84,085 |
| Puget Sound Salish | 33.2 /100 | #186 | Fair $84,011 |
| Belgians | 33.2 /100 | #187 | Fair $84,008 |
| Tlingit-Haida | 32.6 /100 | #188 | Fair $83,968 |
| Immigrants | Colombia | 31.7 /100 | #189 | Fair $83,902 |
| Slovaks | 30.2 /100 | #190 | Fair $83,798 |
| Iraqis | 29.6 /100 | #191 | Fair $83,753 |
| Welsh | 28.0 /100 | #192 | Fair $83,628 |
| Finns | 27.7 /100 | #193 | Fair $83,607 |
| Ghanaians | 27.4 /100 | #194 | Fair $83,582 |
| Immigrants | Armenia | 27.0 /100 | #195 | Fair $83,555 |
| French | 26.0 /100 | #196 | Fair $83,468 |
| Aleuts | 25.7 /100 | #197 | Fair $83,446 |
| Japanese | 25.1 /100 | #198 | Fair $83,395 |
| Germans | 24.6 /100 | #199 | Fair $83,358 |
| Tsimshian | 24.5 /100 | #200 | Fair $83,346 |
| Spanish | 24.4 /100 | #201 | Fair $83,343 |
| Immigrants | Thailand | 24.3 /100 | #202 | Fair $83,327 |