Immigrants from Eastern Africa vs Irish Median Household Income
COMPARE
Immigrants from Eastern Africa
Irish
Median Household Income
Median Household Income Comparison
Immigrants from Eastern Africa
Irish
$84,299
MEDIAN HOUSEHOLD INCOME
37.4/ 100
METRIC RATING
184th/ 347
METRIC RANK
$86,145
MEDIAN HOUSEHOLD INCOME
66.2/ 100
METRIC RATING
164th/ 347
METRIC RANK
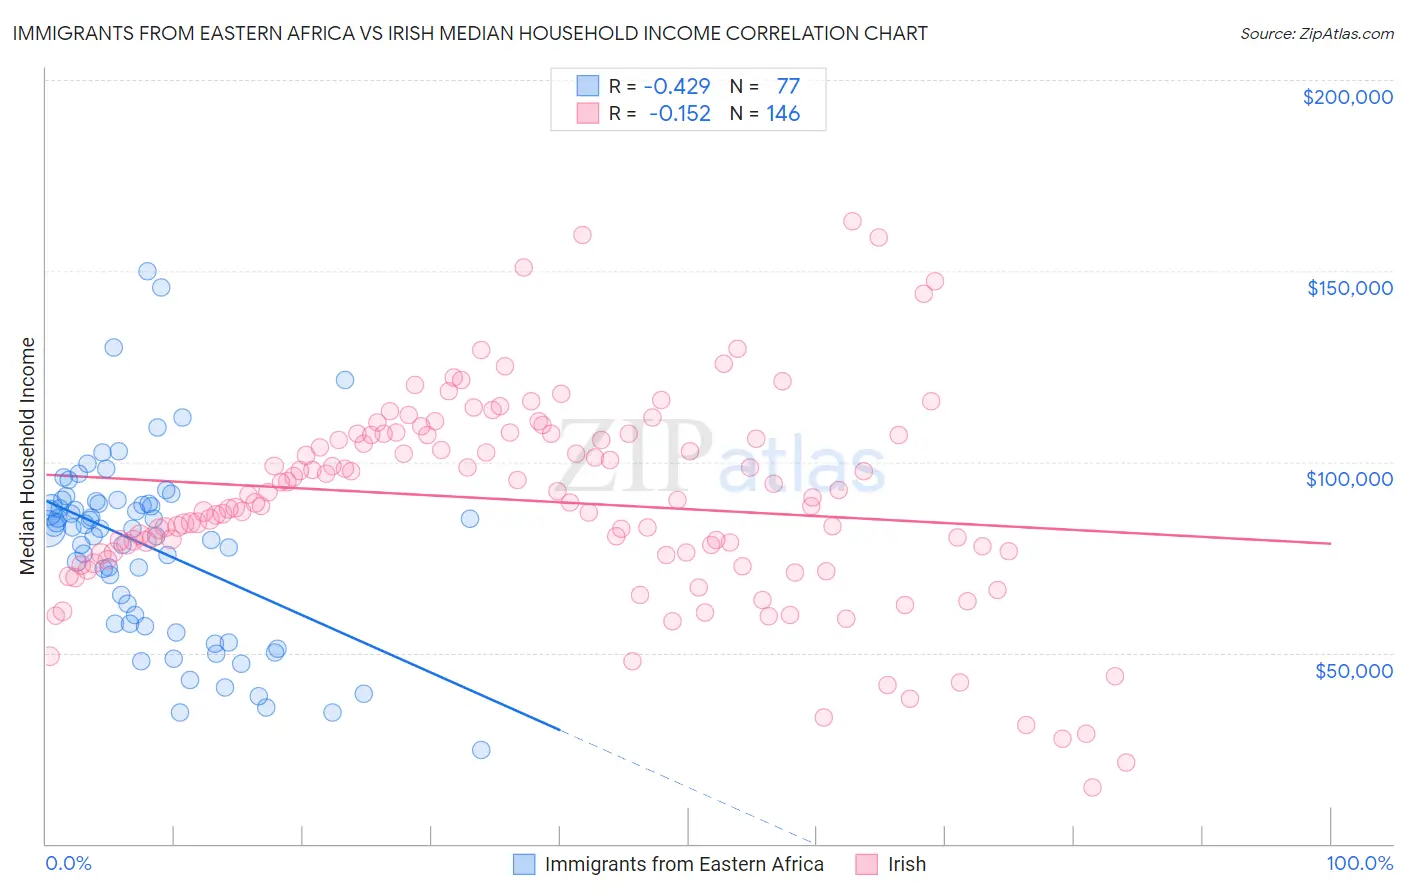
Immigrants from Eastern Africa vs Irish Median Household Income Correlation Chart
The statistical analysis conducted on geographies consisting of 354,838,071 people shows a moderate negative correlation between the proportion of Immigrants from Eastern Africa and median household income in the United States with a correlation coefficient (R) of -0.429 and weighted average of $84,299. Similarly, the statistical analysis conducted on geographies consisting of 579,055,037 people shows a poor negative correlation between the proportion of Irish and median household income in the United States with a correlation coefficient (R) of -0.152 and weighted average of $86,145, a difference of 2.2%.
Median Household Income Correlation Summary
| Measurement | Immigrants from Eastern Africa | Irish |
| Minimum | $24,660 | $14,837 |
| Maximum | $149,957 | $162,948 |
| Range | $125,297 | $148,111 |
| Mean | $77,695 | $89,921 |
| Median | $82,646 | $89,704 |
| Interquartile 25% (IQ1) | $57,630 | $76,304 |
| Interquartile 75% (IQ3) | $89,428 | $107,042 |
| Interquartile Range (IQR) | $31,798 | $30,738 |
| Standard Deviation (Sample) | $24,325 | $26,625 |
| Standard Deviation (Population) | $24,166 | $26,534 |
Demographics Similar to Immigrants from Eastern Africa and Irish by Median Household Income
In terms of median household income, the demographic groups most similar to Immigrants from Eastern Africa are Spaniard ($84,644, a difference of 0.41%), Uruguayan ($84,691, a difference of 0.47%), Hawaiian ($84,729, a difference of 0.51%), Immigrants from Portugal ($84,740, a difference of 0.52%), and English ($84,915, a difference of 0.73%). Similarly, the demographic groups most similar to Irish are Norwegian ($86,084, a difference of 0.070%), Scandinavian ($86,073, a difference of 0.080%), Immigrants ($85,818, a difference of 0.38%), Icelander ($85,797, a difference of 0.41%), and Colombian ($85,716, a difference of 0.50%).
| Demographics | Rating | Rank | Median Household Income |
| Irish | 66.2 /100 | #164 | Good $86,145 |
| Norwegians | 65.3 /100 | #165 | Good $86,084 |
| Scandinavians | 65.1 /100 | #166 | Good $86,073 |
| Immigrants | Immigrants | 61.3 /100 | #167 | Good $85,818 |
| Icelanders | 61.0 /100 | #168 | Good $85,797 |
| Colombians | 59.7 /100 | #169 | Average $85,716 |
| Swiss | 59.2 /100 | #170 | Average $85,681 |
| Immigrants | South America | 58.1 /100 | #171 | Average $85,611 |
| Slovenes | 57.4 /100 | #172 | Average $85,562 |
| Immigrants | Cameroon | 53.4 /100 | #173 | Average $85,314 |
| Scottish | 50.0 /100 | #174 | Average $85,101 |
| Immigrants | Costa Rica | 49.2 /100 | #175 | Average $85,054 |
| Alsatians | 49.2 /100 | #176 | Average $85,053 |
| Immigrants | Eritrea | 48.8 /100 | #177 | Average $85,025 |
| Czechoslovakians | 47.8 /100 | #178 | Average $84,965 |
| English | 47.0 /100 | #179 | Average $84,915 |
| Immigrants | Portugal | 44.2 /100 | #180 | Average $84,740 |
| Hawaiians | 44.1 /100 | #181 | Average $84,729 |
| Uruguayans | 43.5 /100 | #182 | Average $84,691 |
| Spaniards | 42.7 /100 | #183 | Average $84,644 |
| Immigrants | Eastern Africa | 37.4 /100 | #184 | Fair $84,299 |