Immigrants from Cuba vs Immigrants from Fiji Householder Income Ages 25 - 44 years
COMPARE
Immigrants from Cuba
Immigrants from Fiji
Householder Income Ages 25 - 44 years
Householder Income Ages 25 - 44 years Comparison
Immigrants from Cuba
Immigrants from Fiji
$76,701
HOUSEHOLDER INCOME AGES 25 - 44 YEARS
0.0/ 100
METRIC RATING
328th/ 347
METRIC RANK
$103,954
HOUSEHOLDER INCOME AGES 25 - 44 YEARS
99.5/ 100
METRIC RATING
74th/ 347
METRIC RANK
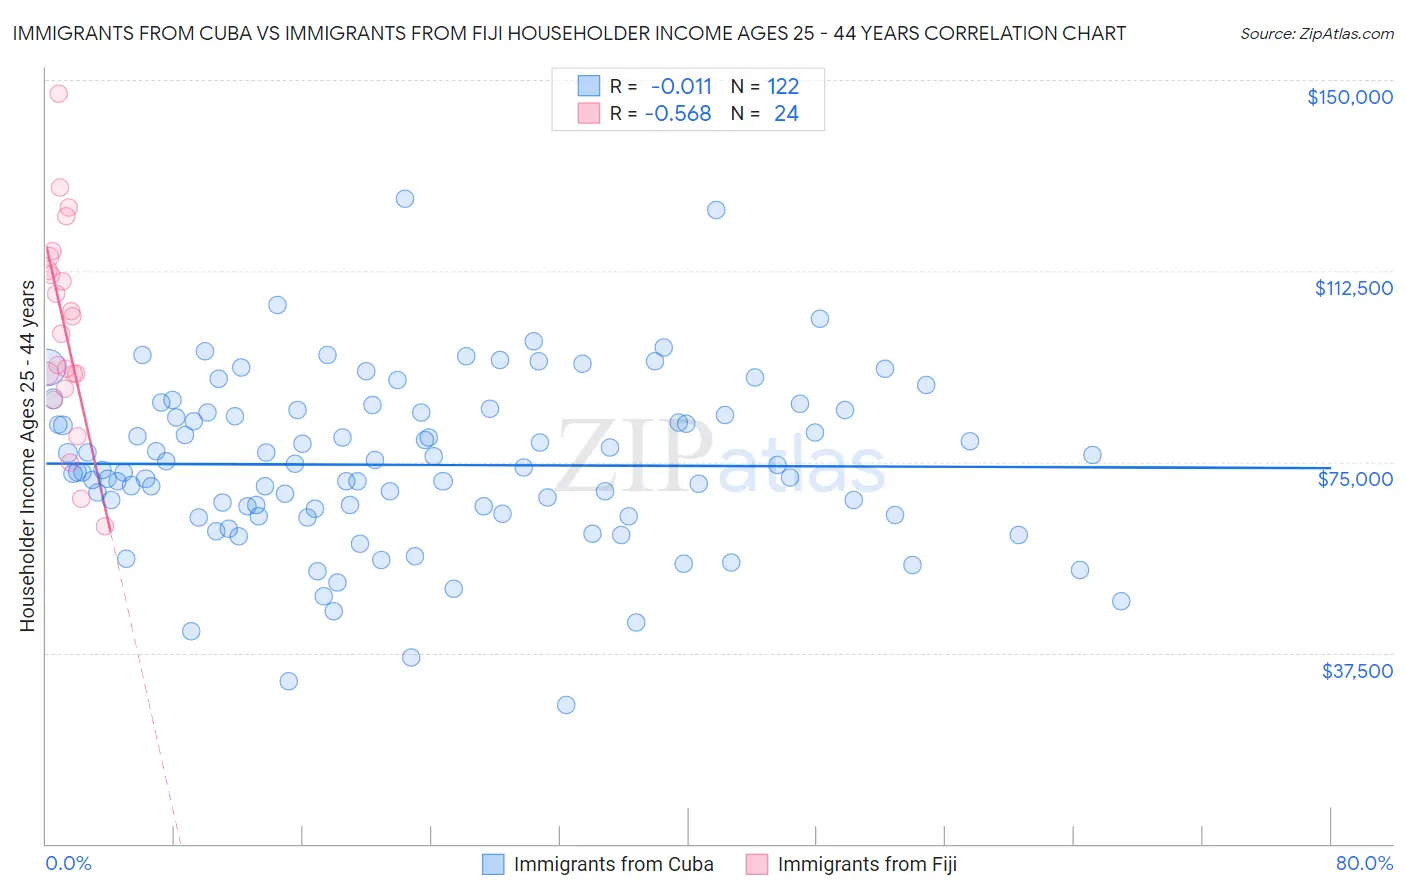
Immigrants from Cuba vs Immigrants from Fiji Householder Income Ages 25 - 44 years Correlation Chart
The statistical analysis conducted on geographies consisting of 325,310,013 people shows no correlation between the proportion of Immigrants from Cuba and household income with householder between the ages 25 and 44 in the United States with a correlation coefficient (R) of -0.011 and weighted average of $76,701. Similarly, the statistical analysis conducted on geographies consisting of 93,741,539 people shows a substantial negative correlation between the proportion of Immigrants from Fiji and household income with householder between the ages 25 and 44 in the United States with a correlation coefficient (R) of -0.568 and weighted average of $103,954, a difference of 35.5%.
Householder Income Ages 25 - 44 years Correlation Summary
| Measurement | Immigrants from Cuba | Immigrants from Fiji |
| Minimum | $27,269 | $62,417 |
| Maximum | $126,663 | $147,220 |
| Range | $99,394 | $84,803 |
| Mean | $74,412 | $101,378 |
| Median | $73,548 | $101,962 |
| Interquartile 25% (IQ1) | $64,878 | $90,849 |
| Interquartile 75% (IQ3) | $84,816 | $113,947 |
| Interquartile Range (IQR) | $19,938 | $23,098 |
| Standard Deviation (Sample) | $16,521 | $20,004 |
| Standard Deviation (Population) | $16,454 | $19,583 |
Similar Demographics by Householder Income Ages 25 - 44 years
Demographics Similar to Immigrants from Cuba by Householder Income Ages 25 - 44 years
In terms of householder income ages 25 - 44 years, the demographic groups most similar to Immigrants from Cuba are Seminole ($76,584, a difference of 0.15%), Immigrants from Bahamas ($76,910, a difference of 0.27%), Houma ($77,044, a difference of 0.45%), Sioux ($77,089, a difference of 0.51%), and Yakama ($76,226, a difference of 0.62%).
| Demographics | Rating | Rank | Householder Income Ages 25 - 44 years |
| Immigrants | Zaire | 0.0 /100 | #321 | Tragic $78,045 |
| Chickasaw | 0.0 /100 | #322 | Tragic $77,929 |
| Immigrants | Honduras | 0.0 /100 | #323 | Tragic $77,328 |
| Dutch West Indians | 0.0 /100 | #324 | Tragic $77,260 |
| Sioux | 0.0 /100 | #325 | Tragic $77,089 |
| Houma | 0.0 /100 | #326 | Tragic $77,044 |
| Immigrants | Bahamas | 0.0 /100 | #327 | Tragic $76,910 |
| Immigrants | Cuba | 0.0 /100 | #328 | Tragic $76,701 |
| Seminole | 0.0 /100 | #329 | Tragic $76,584 |
| Yakama | 0.0 /100 | #330 | Tragic $76,226 |
| Natives/Alaskans | 0.0 /100 | #331 | Tragic $75,647 |
| Bahamians | 0.0 /100 | #332 | Tragic $75,395 |
| Hopi | 0.0 /100 | #333 | Tragic $75,002 |
| Creek | 0.0 /100 | #334 | Tragic $74,847 |
| Kiowa | 0.0 /100 | #335 | Tragic $74,776 |
Demographics Similar to Immigrants from Fiji by Householder Income Ages 25 - 44 years
In terms of householder income ages 25 - 44 years, the demographic groups most similar to Immigrants from Fiji are Korean ($103,824, a difference of 0.13%), Immigrants from Spain ($103,752, a difference of 0.19%), Italian ($104,215, a difference of 0.25%), Chinese ($104,264, a difference of 0.30%), and Afghan ($104,410, a difference of 0.44%).
| Demographics | Rating | Rank | Householder Income Ages 25 - 44 years |
| Immigrants | Romania | 99.6 /100 | #67 | Exceptional $104,713 |
| Immigrants | Eastern Europe | 99.6 /100 | #68 | Exceptional $104,662 |
| Mongolians | 99.6 /100 | #69 | Exceptional $104,578 |
| Immigrants | Croatia | 99.6 /100 | #70 | Exceptional $104,503 |
| Afghans | 99.6 /100 | #71 | Exceptional $104,410 |
| Chinese | 99.5 /100 | #72 | Exceptional $104,264 |
| Italians | 99.5 /100 | #73 | Exceptional $104,215 |
| Immigrants | Fiji | 99.5 /100 | #74 | Exceptional $103,954 |
| Koreans | 99.4 /100 | #75 | Exceptional $103,824 |
| Immigrants | Spain | 99.4 /100 | #76 | Exceptional $103,752 |
| Immigrants | Southern Europe | 99.3 /100 | #77 | Exceptional $103,486 |
| Immigrants | Bulgaria | 99.3 /100 | #78 | Exceptional $103,423 |
| Armenians | 99.2 /100 | #79 | Exceptional $103,248 |
| Immigrants | Egypt | 99.2 /100 | #80 | Exceptional $103,192 |
| South Africans | 99.2 /100 | #81 | Exceptional $103,160 |