Immigrants from Congo vs Portuguese Householder Income Over 65 years
COMPARE
Immigrants from Congo
Portuguese
Householder Income Over 65 years
Householder Income Over 65 years Comparison
Immigrants from Congo
Portuguese
$51,393
HOUSEHOLDER INCOME OVER 65 YEARS
0.0/ 100
METRIC RATING
324th/ 347
METRIC RANK
$61,440
HOUSEHOLDER INCOME OVER 65 YEARS
62.1/ 100
METRIC RATING
160th/ 347
METRIC RANK
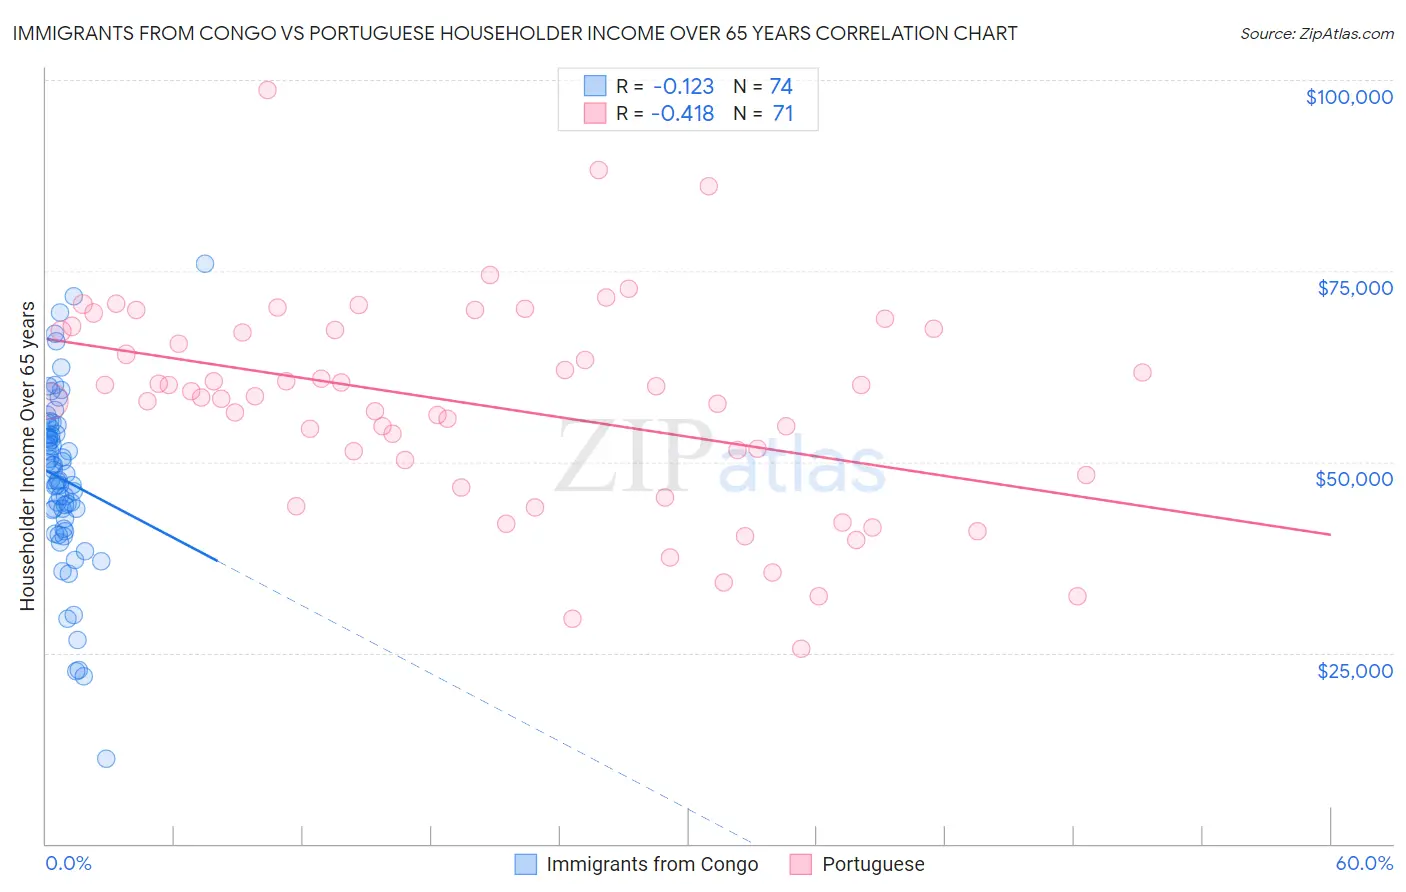
Immigrants from Congo vs Portuguese Householder Income Over 65 years Correlation Chart
The statistical analysis conducted on geographies consisting of 92,030,146 people shows a poor negative correlation between the proportion of Immigrants from Congo and household income with householder over the age of 65 in the United States with a correlation coefficient (R) of -0.123 and weighted average of $51,393. Similarly, the statistical analysis conducted on geographies consisting of 448,159,780 people shows a moderate negative correlation between the proportion of Portuguese and household income with householder over the age of 65 in the United States with a correlation coefficient (R) of -0.418 and weighted average of $61,440, a difference of 19.6%.
Householder Income Over 65 years Correlation Summary
| Measurement | Immigrants from Congo | Portuguese |
| Minimum | $11,111 | $25,525 |
| Maximum | $76,000 | $98,662 |
| Range | $64,889 | $73,137 |
| Mean | $47,689 | $57,386 |
| Median | $48,011 | $58,571 |
| Interquartile 25% (IQ1) | $42,512 | $48,306 |
| Interquartile 75% (IQ3) | $53,762 | $67,302 |
| Interquartile Range (IQR) | $11,250 | $18,996 |
| Standard Deviation (Sample) | $11,475 | $13,814 |
| Standard Deviation (Population) | $11,397 | $13,716 |
Similar Demographics by Householder Income Over 65 years
Demographics Similar to Immigrants from Congo by Householder Income Over 65 years
In terms of householder income over 65 years, the demographic groups most similar to Immigrants from Congo are Cajun ($51,397, a difference of 0.010%), British West Indian ($51,463, a difference of 0.13%), Immigrants from Haiti ($51,219, a difference of 0.34%), Kiowa ($51,140, a difference of 0.49%), and Menominee ($51,719, a difference of 0.63%).
| Demographics | Rating | Rank | Householder Income Over 65 years |
| Immigrants | St. Vincent and the Grenadines | 0.0 /100 | #317 | Tragic $51,922 |
| Haitians | 0.0 /100 | #318 | Tragic $51,912 |
| Immigrants | Honduras | 0.0 /100 | #319 | Tragic $51,888 |
| Colville | 0.0 /100 | #320 | Tragic $51,739 |
| Menominee | 0.0 /100 | #321 | Tragic $51,719 |
| British West Indians | 0.0 /100 | #322 | Tragic $51,463 |
| Cajuns | 0.0 /100 | #323 | Tragic $51,397 |
| Immigrants | Congo | 0.0 /100 | #324 | Tragic $51,393 |
| Immigrants | Haiti | 0.0 /100 | #325 | Tragic $51,219 |
| Kiowa | 0.0 /100 | #326 | Tragic $51,140 |
| Bahamians | 0.0 /100 | #327 | Tragic $51,000 |
| Hopi | 0.0 /100 | #328 | Tragic $50,925 |
| Blacks/African Americans | 0.0 /100 | #329 | Tragic $50,779 |
| Immigrants | Grenada | 0.0 /100 | #330 | Tragic $50,747 |
| Pima | 0.0 /100 | #331 | Tragic $50,539 |
Demographics Similar to Portuguese by Householder Income Over 65 years
In terms of householder income over 65 years, the demographic groups most similar to Portuguese are Brazilian ($61,465, a difference of 0.040%), English ($61,487, a difference of 0.080%), Macedonian ($61,564, a difference of 0.20%), Scandinavian ($61,586, a difference of 0.24%), and Polish ($61,598, a difference of 0.26%).
| Demographics | Rating | Rank | Householder Income Over 65 years |
| Costa Ricans | 66.9 /100 | #153 | Good $61,638 |
| Swiss | 66.5 /100 | #154 | Good $61,621 |
| Poles | 65.9 /100 | #155 | Good $61,598 |
| Scandinavians | 65.6 /100 | #156 | Good $61,586 |
| Macedonians | 65.1 /100 | #157 | Good $61,564 |
| English | 63.3 /100 | #158 | Good $61,487 |
| Brazilians | 62.7 /100 | #159 | Good $61,465 |
| Portuguese | 62.1 /100 | #160 | Good $61,440 |
| Icelanders | 57.9 /100 | #161 | Average $61,270 |
| Czechs | 57.2 /100 | #162 | Average $61,244 |
| Ugandans | 55.5 /100 | #163 | Average $61,177 |
| Immigrants | North Macedonia | 55.4 /100 | #164 | Average $61,175 |
| Immigrants | Ukraine | 55.1 /100 | #165 | Average $61,163 |
| Immigrants | Eastern Africa | 55.0 /100 | #166 | Average $61,157 |
| Norwegians | 53.6 /100 | #167 | Average $61,104 |