Immigrants from South Central Asia vs Immigrants from Grenada Median Female Earnings
COMPARE
Immigrants from South Central Asia
Immigrants from Grenada
Median Female Earnings
Median Female Earnings Comparison
Immigrants from South Central Asia
Immigrants from Grenada
$46,324
MEDIAN FEMALE EARNINGS
100.0/ 100
METRIC RATING
17th/ 347
METRIC RANK
$41,932
MEDIAN FEMALE EARNINGS
99.0/ 100
METRIC RATING
93rd/ 347
METRIC RANK
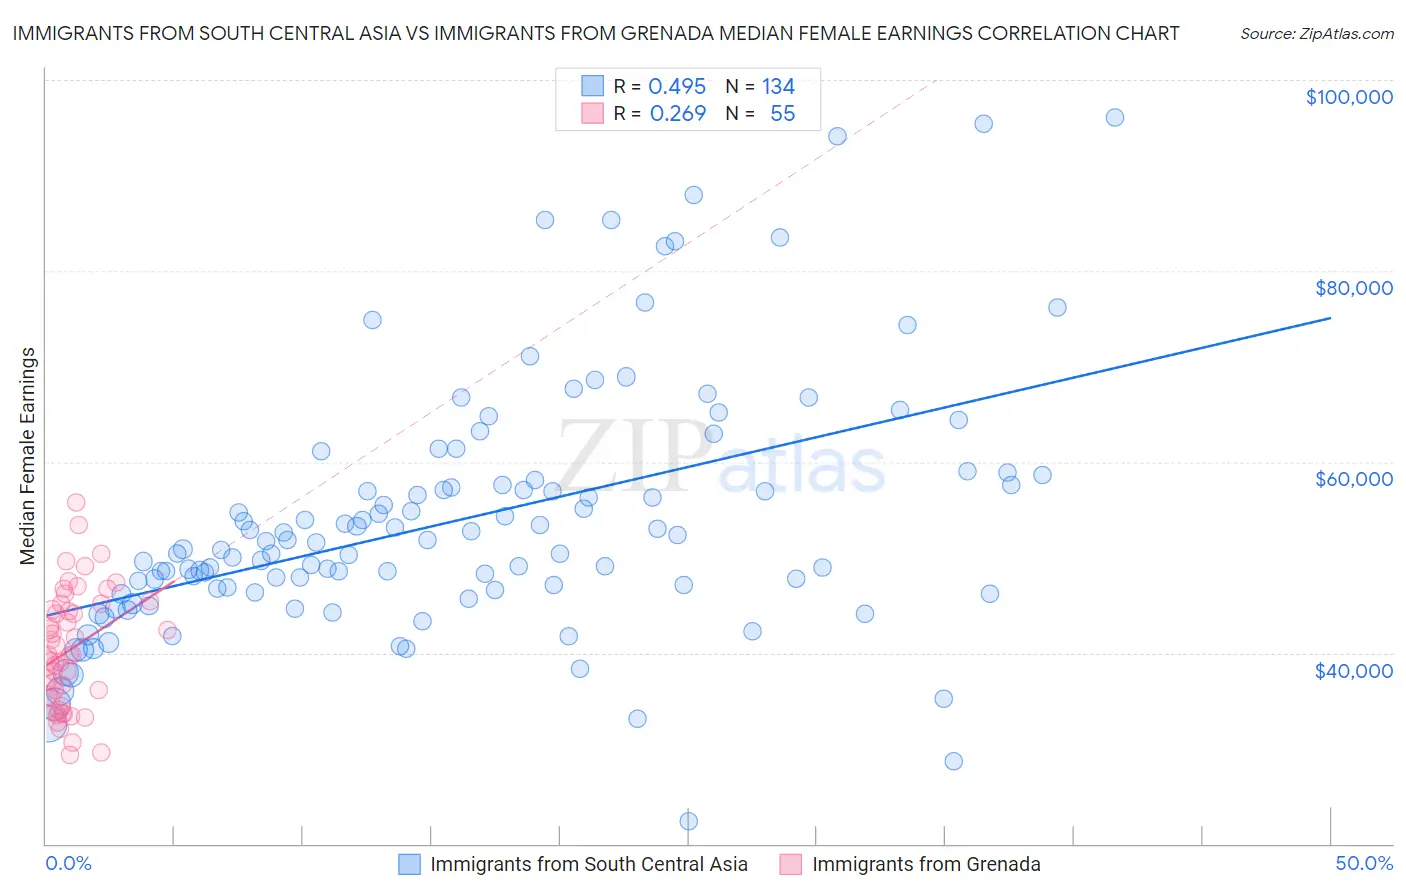
Immigrants from South Central Asia vs Immigrants from Grenada Median Female Earnings Correlation Chart
The statistical analysis conducted on geographies consisting of 472,846,107 people shows a moderate positive correlation between the proportion of Immigrants from South Central Asia and median female earnings in the United States with a correlation coefficient (R) of 0.495 and weighted average of $46,324. Similarly, the statistical analysis conducted on geographies consisting of 67,190,904 people shows a weak positive correlation between the proportion of Immigrants from Grenada and median female earnings in the United States with a correlation coefficient (R) of 0.269 and weighted average of $41,932, a difference of 10.5%.
Median Female Earnings Correlation Summary
| Measurement | Immigrants from South Central Asia | Immigrants from Grenada |
| Minimum | $22,315 | $29,237 |
| Maximum | $96,063 | $55,809 |
| Range | $73,748 | $26,572 |
| Mean | $53,795 | $40,324 |
| Median | $50,791 | $39,773 |
| Interquartile 25% (IQ1) | $46,294 | $35,346 |
| Interquartile 75% (IQ3) | $57,561 | $45,180 |
| Interquartile Range (IQR) | $11,267 | $9,834 |
| Standard Deviation (Sample) | $13,229 | $6,162 |
| Standard Deviation (Population) | $13,180 | $6,105 |
Similar Demographics by Median Female Earnings
Demographics Similar to Immigrants from South Central Asia by Median Female Earnings
In terms of median female earnings, the demographic groups most similar to Immigrants from South Central Asia are Indian (Asian) ($46,481, a difference of 0.34%), Immigrants from Eastern Asia ($46,502, a difference of 0.39%), Soviet Union ($46,556, a difference of 0.50%), Immigrants from Australia ($46,573, a difference of 0.54%), and Immigrants from Israel ($46,902, a difference of 1.3%).
| Demographics | Rating | Rank | Median Female Earnings |
| Immigrants | China | 100.0 /100 | #10 | Exceptional $46,972 |
| Okinawans | 100.0 /100 | #11 | Exceptional $46,905 |
| Immigrants | Israel | 100.0 /100 | #12 | Exceptional $46,902 |
| Immigrants | Australia | 100.0 /100 | #13 | Exceptional $46,573 |
| Soviet Union | 100.0 /100 | #14 | Exceptional $46,556 |
| Immigrants | Eastern Asia | 100.0 /100 | #15 | Exceptional $46,502 |
| Indians (Asian) | 100.0 /100 | #16 | Exceptional $46,481 |
| Immigrants | South Central Asia | 100.0 /100 | #17 | Exceptional $46,324 |
| Cypriots | 100.0 /100 | #18 | Exceptional $45,570 |
| Eastern Europeans | 100.0 /100 | #19 | Exceptional $45,385 |
| Immigrants | Japan | 100.0 /100 | #20 | Exceptional $45,323 |
| Cambodians | 100.0 /100 | #21 | Exceptional $45,014 |
| Immigrants | Greece | 100.0 /100 | #22 | Exceptional $44,976 |
| Burmese | 100.0 /100 | #23 | Exceptional $44,911 |
| Immigrants | Korea | 100.0 /100 | #24 | Exceptional $44,847 |
Demographics Similar to Immigrants from Grenada by Median Female Earnings
In terms of median female earnings, the demographic groups most similar to Immigrants from Grenada are Argentinean ($41,952, a difference of 0.050%), Immigrants from Western Europe ($41,990, a difference of 0.14%), Moroccan ($41,872, a difference of 0.14%), Immigrants from Netherlands ($41,870, a difference of 0.15%), and Ukrainian ($42,015, a difference of 0.20%).
| Demographics | Rating | Rank | Median Female Earnings |
| Immigrants | St. Vincent and the Grenadines | 99.3 /100 | #86 | Exceptional $42,108 |
| Lithuanians | 99.3 /100 | #87 | Exceptional $42,108 |
| Immigrants | Northern Africa | 99.3 /100 | #88 | Exceptional $42,084 |
| Immigrants | Afghanistan | 99.3 /100 | #89 | Exceptional $42,055 |
| Ukrainians | 99.2 /100 | #90 | Exceptional $42,015 |
| Immigrants | Western Europe | 99.2 /100 | #91 | Exceptional $41,990 |
| Argentineans | 99.1 /100 | #92 | Exceptional $41,952 |
| Immigrants | Grenada | 99.0 /100 | #93 | Exceptional $41,932 |
| Moroccans | 98.9 /100 | #94 | Exceptional $41,872 |
| Immigrants | Netherlands | 98.9 /100 | #95 | Exceptional $41,870 |
| South Africans | 98.8 /100 | #96 | Exceptional $41,825 |
| Immigrants | Hungary | 98.8 /100 | #97 | Exceptional $41,820 |
| Immigrants | Scotland | 98.7 /100 | #98 | Exceptional $41,771 |
| Immigrants | Barbados | 98.4 /100 | #99 | Exceptional $41,685 |
| Romanians | 98.3 /100 | #100 | Exceptional $41,663 |