Immigrants from Cameroon vs Immigrants from Venezuela Householder Income Over 65 years
COMPARE
Immigrants from Cameroon
Immigrants from Venezuela
Householder Income Over 65 years
Householder Income Over 65 years Comparison
Immigrants from Cameroon
Immigrants from Venezuela
$63,907
HOUSEHOLDER INCOME OVER 65 YEARS
95.6/ 100
METRIC RATING
104th/ 347
METRIC RANK
$57,371
HOUSEHOLDER INCOME OVER 65 YEARS
2.3/ 100
METRIC RATING
232nd/ 347
METRIC RANK
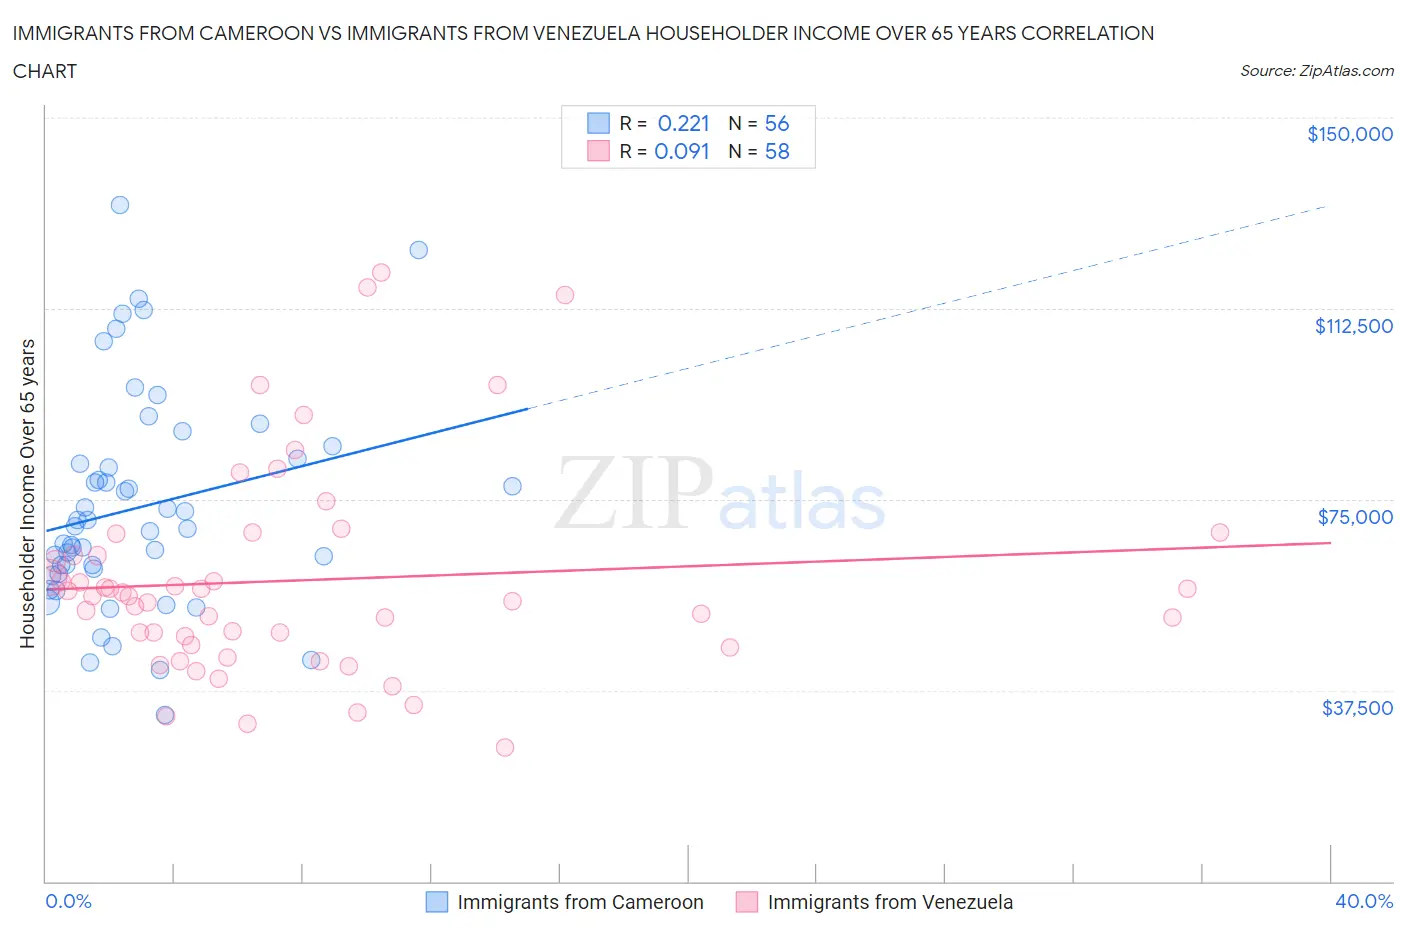
Immigrants from Cameroon vs Immigrants from Venezuela Householder Income Over 65 years Correlation Chart
The statistical analysis conducted on geographies consisting of 130,525,234 people shows a weak positive correlation between the proportion of Immigrants from Cameroon and household income with householder over the age of 65 in the United States with a correlation coefficient (R) of 0.221 and weighted average of $63,907. Similarly, the statistical analysis conducted on geographies consisting of 287,361,159 people shows a slight positive correlation between the proportion of Immigrants from Venezuela and household income with householder over the age of 65 in the United States with a correlation coefficient (R) of 0.091 and weighted average of $57,371, a difference of 11.4%.
Householder Income Over 65 years Correlation Summary
| Measurement | Immigrants from Cameroon | Immigrants from Venezuela |
| Minimum | $32,708 | $26,376 |
| Maximum | $132,857 | $119,643 |
| Range | $100,149 | $93,267 |
| Mean | $73,454 | $59,079 |
| Median | $69,536 | $55,975 |
| Interquartile 25% (IQ1) | $60,820 | $46,366 |
| Interquartile 75% (IQ3) | $82,446 | $63,983 |
| Interquartile Range (IQR) | $21,626 | $17,617 |
| Standard Deviation (Sample) | $21,221 | $20,462 |
| Standard Deviation (Population) | $21,031 | $20,285 |
Similar Demographics by Householder Income Over 65 years
Demographics Similar to Immigrants from Cameroon by Householder Income Over 65 years
In terms of householder income over 65 years, the demographic groups most similar to Immigrants from Cameroon are Italian ($63,885, a difference of 0.030%), Immigrants from Argentina ($63,885, a difference of 0.030%), British ($63,940, a difference of 0.050%), Chilean ($63,957, a difference of 0.080%), and Pakistani ($63,844, a difference of 0.10%).
| Demographics | Rating | Rank | Householder Income Over 65 years |
| Sri Lankans | 96.7 /100 | #97 | Exceptional $64,201 |
| Romanians | 96.5 /100 | #98 | Exceptional $64,142 |
| Assyrians/Chaldeans/Syriacs | 96.4 /100 | #99 | Exceptional $64,108 |
| Immigrants | South Eastern Asia | 96.3 /100 | #100 | Exceptional $64,089 |
| Immigrants | Italy | 96.2 /100 | #101 | Exceptional $64,065 |
| Chileans | 95.8 /100 | #102 | Exceptional $63,957 |
| British | 95.7 /100 | #103 | Exceptional $63,940 |
| Immigrants | Cameroon | 95.6 /100 | #104 | Exceptional $63,907 |
| Italians | 95.5 /100 | #105 | Exceptional $63,885 |
| Immigrants | Argentina | 95.5 /100 | #106 | Exceptional $63,885 |
| Pakistanis | 95.3 /100 | #107 | Exceptional $63,844 |
| Palestinians | 95.1 /100 | #108 | Exceptional $63,800 |
| Europeans | 95.0 /100 | #109 | Exceptional $63,779 |
| Immigrants | Zimbabwe | 94.3 /100 | #110 | Exceptional $63,643 |
| Immigrants | Spain | 93.7 /100 | #111 | Exceptional $63,540 |
Demographics Similar to Immigrants from Venezuela by Householder Income Over 65 years
In terms of householder income over 65 years, the demographic groups most similar to Immigrants from Venezuela are Nonimmigrants ($57,426, a difference of 0.090%), Immigrants from Cambodia ($57,580, a difference of 0.36%), Immigrants from Western Africa ($57,119, a difference of 0.44%), Immigrants from Burma/Myanmar ($57,114, a difference of 0.45%), and Immigrants from Colombia ($57,658, a difference of 0.50%).
| Demographics | Rating | Rank | Householder Income Over 65 years |
| Venezuelans | 4.4 /100 | #225 | Tragic $58,026 |
| French Canadians | 4.2 /100 | #226 | Tragic $57,975 |
| Japanese | 3.9 /100 | #227 | Tragic $57,919 |
| Immigrants | Albania | 3.6 /100 | #228 | Tragic $57,828 |
| Immigrants | Colombia | 3.0 /100 | #229 | Tragic $57,658 |
| Immigrants | Cambodia | 2.8 /100 | #230 | Tragic $57,580 |
| Immigrants | Nonimmigrants | 2.4 /100 | #231 | Tragic $57,426 |
| Immigrants | Venezuela | 2.3 /100 | #232 | Tragic $57,371 |
| Immigrants | Western Africa | 1.7 /100 | #233 | Tragic $57,119 |
| Immigrants | Burma/Myanmar | 1.7 /100 | #234 | Tragic $57,114 |
| Spanish Americans | 1.6 /100 | #235 | Tragic $57,021 |
| Immigrants | Uruguay | 1.5 /100 | #236 | Tragic $56,975 |
| Immigrants | Panama | 1.5 /100 | #237 | Tragic $56,944 |
| Fijians | 1.2 /100 | #238 | Tragic $56,768 |
| Immigrants | Laos | 1.2 /100 | #239 | Tragic $56,722 |