Immigrants from Brazil vs Immigrants from Canada Householder Income Under 25 years
COMPARE
Immigrants from Brazil
Immigrants from Canada
Householder Income Under 25 years
Householder Income Under 25 years Comparison
Immigrants from Brazil
Immigrants from Canada
$54,487
HOUSEHOLDER INCOME UNDER 25 YEARS
99.6/ 100
METRIC RATING
76th/ 347
METRIC RANK
$53,411
HOUSEHOLDER INCOME UNDER 25 YEARS
95.2/ 100
METRIC RATING
121st/ 347
METRIC RANK
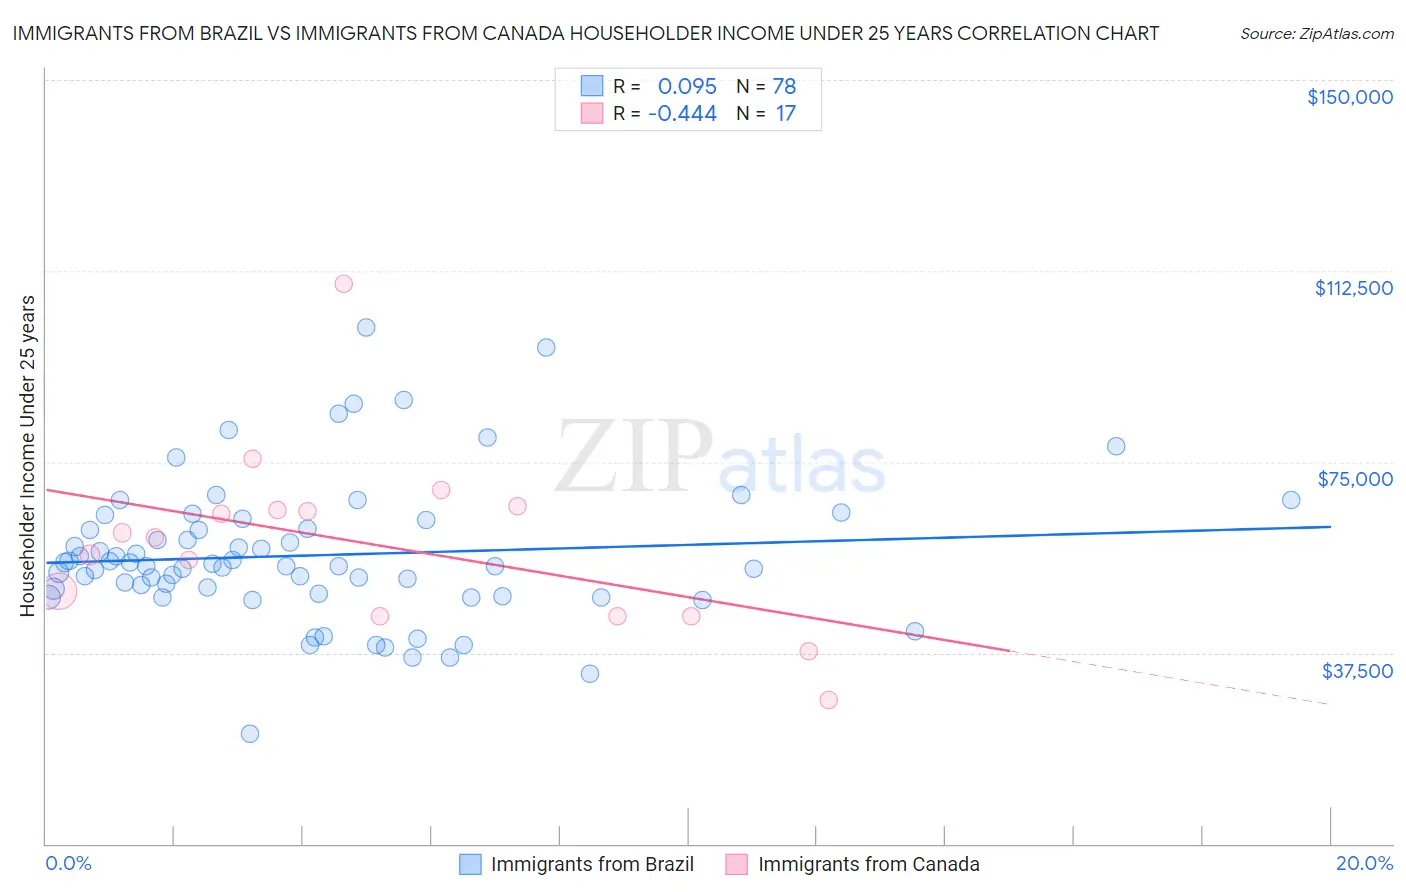
Immigrants from Brazil vs Immigrants from Canada Householder Income Under 25 years Correlation Chart
The statistical analysis conducted on geographies consisting of 290,809,322 people shows a slight positive correlation between the proportion of Immigrants from Brazil and household income with householder under the age of 25 in the United States with a correlation coefficient (R) of 0.095 and weighted average of $54,487. Similarly, the statistical analysis conducted on geographies consisting of 375,368,840 people shows a moderate negative correlation between the proportion of Immigrants from Canada and household income with householder under the age of 25 in the United States with a correlation coefficient (R) of -0.444 and weighted average of $53,411, a difference of 2.0%.
Householder Income Under 25 years Correlation Summary
| Measurement | Immigrants from Brazil | Immigrants from Canada |
| Minimum | $21,618 | $28,317 |
| Maximum | $101,440 | $109,961 |
| Range | $79,822 | $81,644 |
| Mean | $56,652 | $58,863 |
| Median | $54,576 | $60,245 |
| Interquartile 25% (IQ1) | $49,112 | $44,733 |
| Interquartile 75% (IQ3) | $61,875 | $65,961 |
| Interquartile Range (IQR) | $12,763 | $21,228 |
| Standard Deviation (Sample) | $13,948 | $18,135 |
| Standard Deviation (Population) | $13,859 | $17,594 |
Similar Demographics by Householder Income Under 25 years
Demographics Similar to Immigrants from Brazil by Householder Income Under 25 years
In terms of householder income under 25 years, the demographic groups most similar to Immigrants from Brazil are Immigrants from Southern Europe ($54,484, a difference of 0.010%), Nepalese ($54,472, a difference of 0.030%), Immigrants from Sri Lanka ($54,512, a difference of 0.050%), Immigrants from Italy ($54,449, a difference of 0.070%), and Egyptian ($54,444, a difference of 0.080%).
| Demographics | Rating | Rank | Householder Income Under 25 years |
| Samoans | 99.7 /100 | #69 | Exceptional $54,610 |
| Immigrants | El Salvador | 99.7 /100 | #70 | Exceptional $54,599 |
| Immigrants | Morocco | 99.7 /100 | #71 | Exceptional $54,593 |
| Immigrants | Northern Europe | 99.7 /100 | #72 | Exceptional $54,571 |
| Macedonians | 99.7 /100 | #73 | Exceptional $54,563 |
| Immigrants | Grenada | 99.7 /100 | #74 | Exceptional $54,538 |
| Immigrants | Sri Lanka | 99.7 /100 | #75 | Exceptional $54,512 |
| Immigrants | Brazil | 99.6 /100 | #76 | Exceptional $54,487 |
| Immigrants | Southern Europe | 99.6 /100 | #77 | Exceptional $54,484 |
| Nepalese | 99.6 /100 | #78 | Exceptional $54,472 |
| Immigrants | Italy | 99.6 /100 | #79 | Exceptional $54,449 |
| Egyptians | 99.6 /100 | #80 | Exceptional $54,444 |
| Portuguese | 99.6 /100 | #81 | Exceptional $54,436 |
| Russians | 99.5 /100 | #82 | Exceptional $54,389 |
| Laotians | 99.5 /100 | #83 | Exceptional $54,369 |
Demographics Similar to Immigrants from Canada by Householder Income Under 25 years
In terms of householder income under 25 years, the demographic groups most similar to Immigrants from Canada are Immigrants from Ethiopia ($53,408, a difference of 0.010%), Guamanian/Chamorro ($53,423, a difference of 0.020%), Italian ($53,426, a difference of 0.030%), Immigrants from Iraq ($53,384, a difference of 0.050%), and Colombian ($53,357, a difference of 0.10%).
| Demographics | Rating | Rank | Householder Income Under 25 years |
| Immigrants | Sweden | 97.1 /100 | #114 | Exceptional $53,621 |
| Immigrants | Albania | 96.9 /100 | #115 | Exceptional $53,597 |
| Immigrants | Spain | 96.6 /100 | #116 | Exceptional $53,560 |
| Lithuanians | 96.6 /100 | #117 | Exceptional $53,552 |
| Immigrants | Switzerland | 96.3 /100 | #118 | Exceptional $53,528 |
| Italians | 95.4 /100 | #119 | Exceptional $53,426 |
| Guamanians/Chamorros | 95.3 /100 | #120 | Exceptional $53,423 |
| Immigrants | Canada | 95.2 /100 | #121 | Exceptional $53,411 |
| Immigrants | Ethiopia | 95.2 /100 | #122 | Exceptional $53,408 |
| Immigrants | Iraq | 94.9 /100 | #123 | Exceptional $53,384 |
| Colombians | 94.6 /100 | #124 | Exceptional $53,357 |
| Pakistanis | 94.1 /100 | #125 | Exceptional $53,325 |
| Immigrants | Serbia | 94.1 /100 | #126 | Exceptional $53,321 |
| Immigrants | North America | 93.9 /100 | #127 | Exceptional $53,307 |
| Immigrants | Bulgaria | 93.9 /100 | #128 | Exceptional $53,305 |