Immigrants from Belize vs Potawatomi Per Capita Income
COMPARE
Immigrants from Belize
Potawatomi
Per Capita Income
Per Capita Income Comparison
Immigrants from Belize
Potawatomi
$38,614
PER CAPITA INCOME
0.3/ 100
METRIC RATING
270th/ 347
METRIC RANK
$38,046
PER CAPITA INCOME
0.2/ 100
METRIC RATING
280th/ 347
METRIC RANK
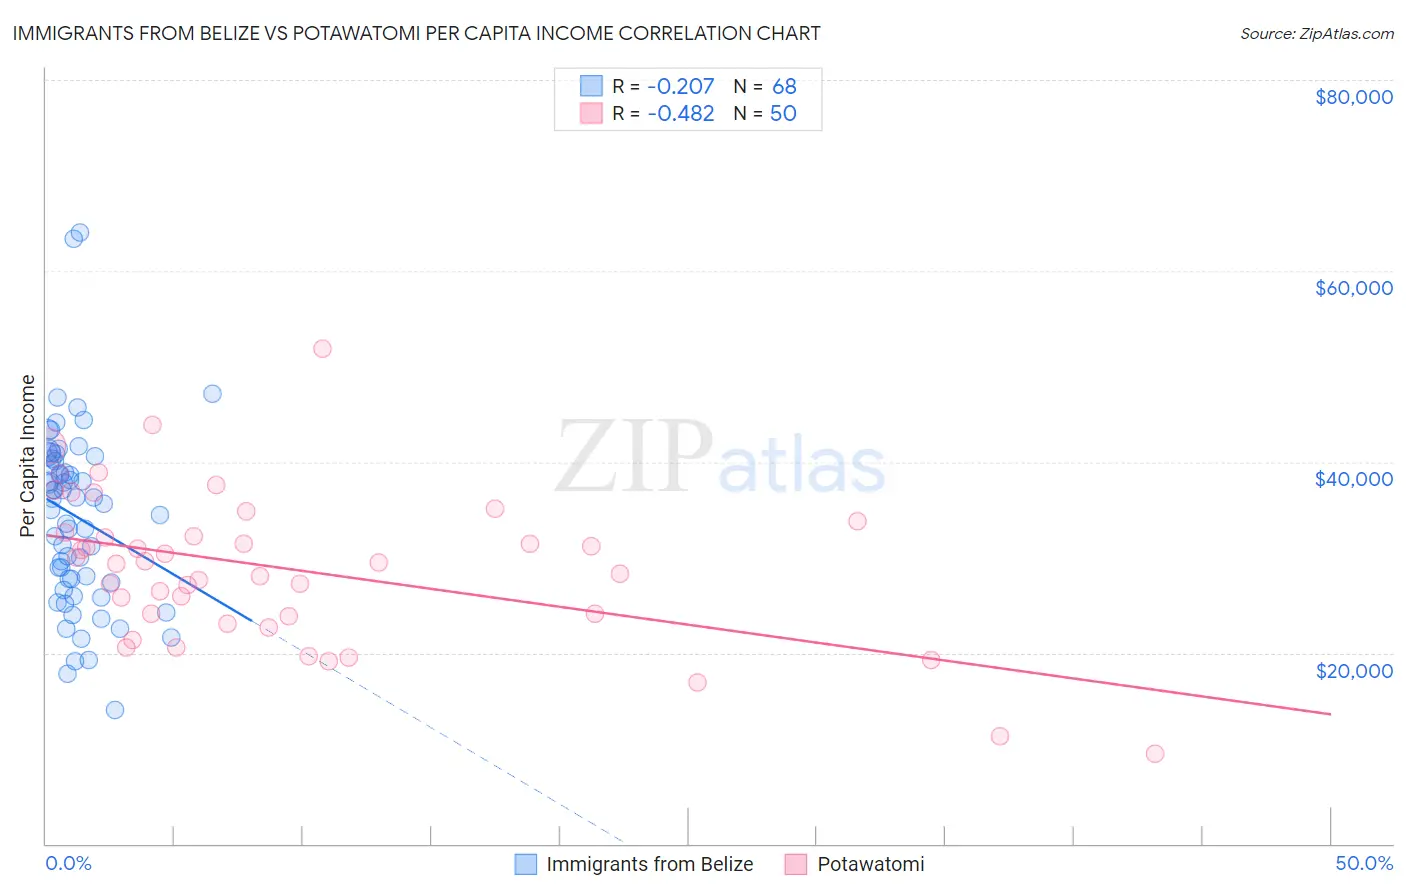
Immigrants from Belize vs Potawatomi Per Capita Income Correlation Chart
The statistical analysis conducted on geographies consisting of 130,314,146 people shows a weak negative correlation between the proportion of Immigrants from Belize and per capita income in the United States with a correlation coefficient (R) of -0.207 and weighted average of $38,614. Similarly, the statistical analysis conducted on geographies consisting of 117,768,459 people shows a moderate negative correlation between the proportion of Potawatomi and per capita income in the United States with a correlation coefficient (R) of -0.482 and weighted average of $38,046, a difference of 1.5%.
Per Capita Income Correlation Summary
| Measurement | Immigrants from Belize | Potawatomi |
| Minimum | $13,974 | $9,447 |
| Maximum | $63,996 | $51,870 |
| Range | $50,022 | $42,423 |
| Mean | $34,271 | $28,766 |
| Median | $35,906 | $29,420 |
| Interquartile 25% (IQ1) | $27,515 | $23,768 |
| Interquartile 75% (IQ3) | $40,202 | $32,549 |
| Interquartile Range (IQR) | $12,687 | $8,781 |
| Standard Deviation (Sample) | $9,371 | $7,980 |
| Standard Deviation (Population) | $9,302 | $7,900 |
Demographics Similar to Immigrants from Belize and Potawatomi by Per Capita Income
In terms of per capita income, the demographic groups most similar to Immigrants from Belize are Central American ($38,560, a difference of 0.14%), Immigrants from Cabo Verde ($38,540, a difference of 0.19%), Immigrants from Jamaica ($38,766, a difference of 0.39%), Liberian ($38,780, a difference of 0.43%), and Nepalese ($38,442, a difference of 0.45%). Similarly, the demographic groups most similar to Potawatomi are Colville ($38,047, a difference of 0.0%), Immigrants from Nicaragua ($38,065, a difference of 0.050%), Comanche ($38,088, a difference of 0.11%), Hmong ($38,120, a difference of 0.20%), and Immigrants from Dominica ($37,952, a difference of 0.25%).
| Demographics | Rating | Rank | Per Capita Income |
| Spanish Americans | 0.5 /100 | #265 | Tragic $39,012 |
| Salvadorans | 0.5 /100 | #266 | Tragic $38,858 |
| Immigrants | Zaire | 0.4 /100 | #267 | Tragic $38,848 |
| Liberians | 0.4 /100 | #268 | Tragic $38,780 |
| Immigrants | Jamaica | 0.4 /100 | #269 | Tragic $38,766 |
| Immigrants | Belize | 0.3 /100 | #270 | Tragic $38,614 |
| Central Americans | 0.3 /100 | #271 | Tragic $38,560 |
| Immigrants | Cabo Verde | 0.3 /100 | #272 | Tragic $38,540 |
| Nepalese | 0.3 /100 | #273 | Tragic $38,442 |
| Immigrants | El Salvador | 0.3 /100 | #274 | Tragic $38,394 |
| Immigrants | Liberia | 0.2 /100 | #275 | Tragic $38,165 |
| Hmong | 0.2 /100 | #276 | Tragic $38,120 |
| Comanche | 0.2 /100 | #277 | Tragic $38,088 |
| Immigrants | Nicaragua | 0.2 /100 | #278 | Tragic $38,065 |
| Colville | 0.2 /100 | #279 | Tragic $38,047 |
| Potawatomi | 0.2 /100 | #280 | Tragic $38,046 |
| Immigrants | Dominica | 0.2 /100 | #281 | Tragic $37,952 |
| Immigrants | Laos | 0.1 /100 | #282 | Tragic $37,857 |
| Pennsylvania Germans | 0.1 /100 | #283 | Tragic $37,842 |
| Africans | 0.1 /100 | #284 | Tragic $37,785 |
| Guatemalans | 0.1 /100 | #285 | Tragic $37,766 |