Immigrants from Belarus vs Immigrants from Kazakhstan Householder Income Ages 25 - 44 years
COMPARE
Immigrants from Belarus
Immigrants from Kazakhstan
Householder Income Ages 25 - 44 years
Householder Income Ages 25 - 44 years Comparison
Immigrants from Belarus
Immigrants from Kazakhstan
$107,393
HOUSEHOLDER INCOME AGES 25 - 44 YEARS
99.9/ 100
METRIC RATING
46th/ 347
METRIC RANK
$101,727
HOUSEHOLDER INCOME AGES 25 - 44 YEARS
98.1/ 100
METRIC RATING
98th/ 347
METRIC RANK
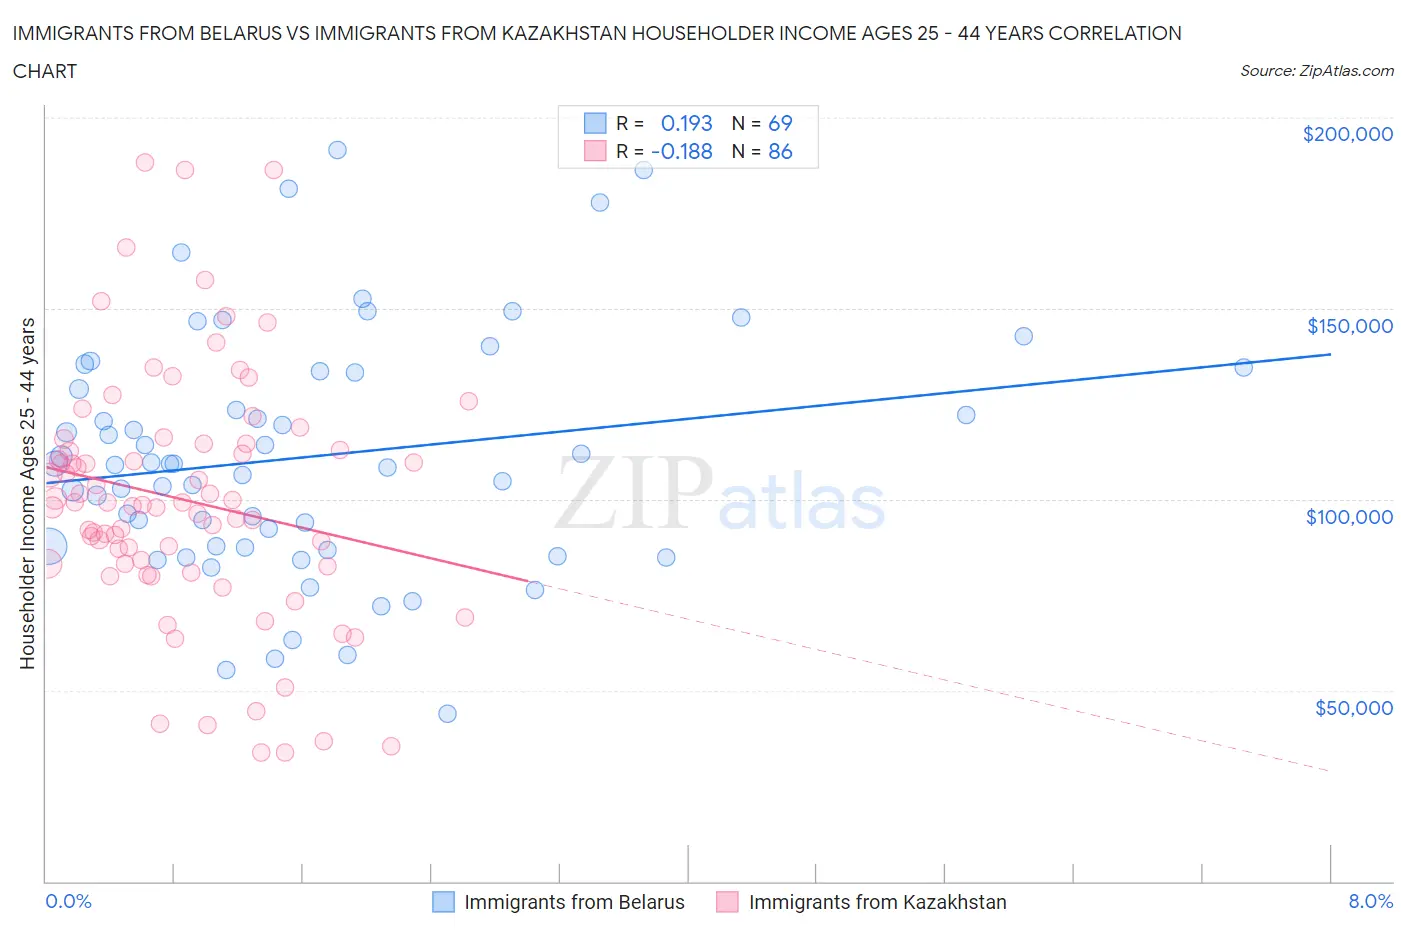
Immigrants from Belarus vs Immigrants from Kazakhstan Householder Income Ages 25 - 44 years Correlation Chart
The statistical analysis conducted on geographies consisting of 150,157,706 people shows a poor positive correlation between the proportion of Immigrants from Belarus and household income with householder between the ages 25 and 44 in the United States with a correlation coefficient (R) of 0.193 and weighted average of $107,393. Similarly, the statistical analysis conducted on geographies consisting of 124,395,234 people shows a poor negative correlation between the proportion of Immigrants from Kazakhstan and household income with householder between the ages 25 and 44 in the United States with a correlation coefficient (R) of -0.188 and weighted average of $101,727, a difference of 5.6%.
Householder Income Ages 25 - 44 years Correlation Summary
| Measurement | Immigrants from Belarus | Immigrants from Kazakhstan |
| Minimum | $43,724 | $33,710 |
| Maximum | $191,528 | $188,234 |
| Range | $147,804 | $154,524 |
| Mean | $111,122 | $99,834 |
| Median | $109,354 | $98,784 |
| Interquartile 25% (IQ1) | $87,522 | $83,191 |
| Interquartile 75% (IQ3) | $133,299 | $114,592 |
| Interquartile Range (IQR) | $45,777 | $31,401 |
| Standard Deviation (Sample) | $31,608 | $32,549 |
| Standard Deviation (Population) | $31,378 | $32,360 |
Similar Demographics by Householder Income Ages 25 - 44 years
Demographics Similar to Immigrants from Belarus by Householder Income Ages 25 - 44 years
In terms of householder income ages 25 - 44 years, the demographic groups most similar to Immigrants from Belarus are Estonian ($107,269, a difference of 0.12%), Bulgarian ($107,264, a difference of 0.12%), Immigrants from Turkey ($107,258, a difference of 0.13%), Israeli ($107,579, a difference of 0.17%), and Immigrants from Indonesia ($107,627, a difference of 0.22%).
| Demographics | Rating | Rank | Householder Income Ages 25 - 44 years |
| Immigrants | France | 99.9 /100 | #39 | Exceptional $108,257 |
| Immigrants | Lithuania | 99.9 /100 | #40 | Exceptional $108,149 |
| Immigrants | Bolivia | 99.9 /100 | #41 | Exceptional $108,128 |
| Australians | 99.9 /100 | #42 | Exceptional $107,912 |
| Immigrants | Malaysia | 99.9 /100 | #43 | Exceptional $107,650 |
| Immigrants | Indonesia | 99.9 /100 | #44 | Exceptional $107,627 |
| Israelis | 99.9 /100 | #45 | Exceptional $107,579 |
| Immigrants | Belarus | 99.9 /100 | #46 | Exceptional $107,393 |
| Estonians | 99.9 /100 | #47 | Exceptional $107,269 |
| Bulgarians | 99.9 /100 | #48 | Exceptional $107,264 |
| Immigrants | Turkey | 99.9 /100 | #49 | Exceptional $107,258 |
| Cambodians | 99.9 /100 | #50 | Exceptional $107,148 |
| Immigrants | Czechoslovakia | 99.9 /100 | #51 | Exceptional $106,888 |
| Immigrants | Europe | 99.9 /100 | #52 | Exceptional $106,817 |
| Immigrants | Norway | 99.9 /100 | #53 | Exceptional $106,629 |
Demographics Similar to Immigrants from Kazakhstan by Householder Income Ages 25 - 44 years
In terms of householder income ages 25 - 44 years, the demographic groups most similar to Immigrants from Kazakhstan are Austrian ($101,842, a difference of 0.11%), Macedonian ($101,882, a difference of 0.15%), Assyrian/Chaldean/Syriac ($101,936, a difference of 0.21%), Sri Lankan ($101,960, a difference of 0.23%), and Taiwanese ($101,492, a difference of 0.23%).
| Demographics | Rating | Rank | Householder Income Ages 25 - 44 years |
| Croatians | 98.7 /100 | #91 | Exceptional $102,414 |
| Immigrants | North America | 98.7 /100 | #92 | Exceptional $102,407 |
| Immigrants | England | 98.4 /100 | #93 | Exceptional $102,020 |
| Sri Lankans | 98.4 /100 | #94 | Exceptional $101,960 |
| Assyrians/Chaldeans/Syriacs | 98.3 /100 | #95 | Exceptional $101,936 |
| Macedonians | 98.3 /100 | #96 | Exceptional $101,882 |
| Austrians | 98.3 /100 | #97 | Exceptional $101,842 |
| Immigrants | Kazakhstan | 98.1 /100 | #98 | Exceptional $101,727 |
| Taiwanese | 97.9 /100 | #99 | Exceptional $101,492 |
| Immigrants | Argentina | 97.8 /100 | #100 | Exceptional $101,415 |
| Albanians | 97.8 /100 | #101 | Exceptional $101,367 |
| Immigrants | Lebanon | 97.4 /100 | #102 | Exceptional $101,124 |
| Immigrants | Moldova | 97.4 /100 | #103 | Exceptional $101,091 |
| Immigrants | Poland | 97.4 /100 | #104 | Exceptional $101,065 |
| Immigrants | Vietnam | 96.5 /100 | #105 | Exceptional $100,535 |