Immigrants from Bahamas vs Jamaican Householder Income Under 25 years
COMPARE
Immigrants from Bahamas
Jamaican
Householder Income Under 25 years
Householder Income Under 25 years Comparison
Immigrants from Bahamas
Jamaicans
$45,793
HOUSEHOLDER INCOME UNDER 25 YEARS
0.0/ 100
METRIC RATING
325th/ 347
METRIC RANK
$50,929
HOUSEHOLDER INCOME UNDER 25 YEARS
4.4/ 100
METRIC RATING
230th/ 347
METRIC RANK
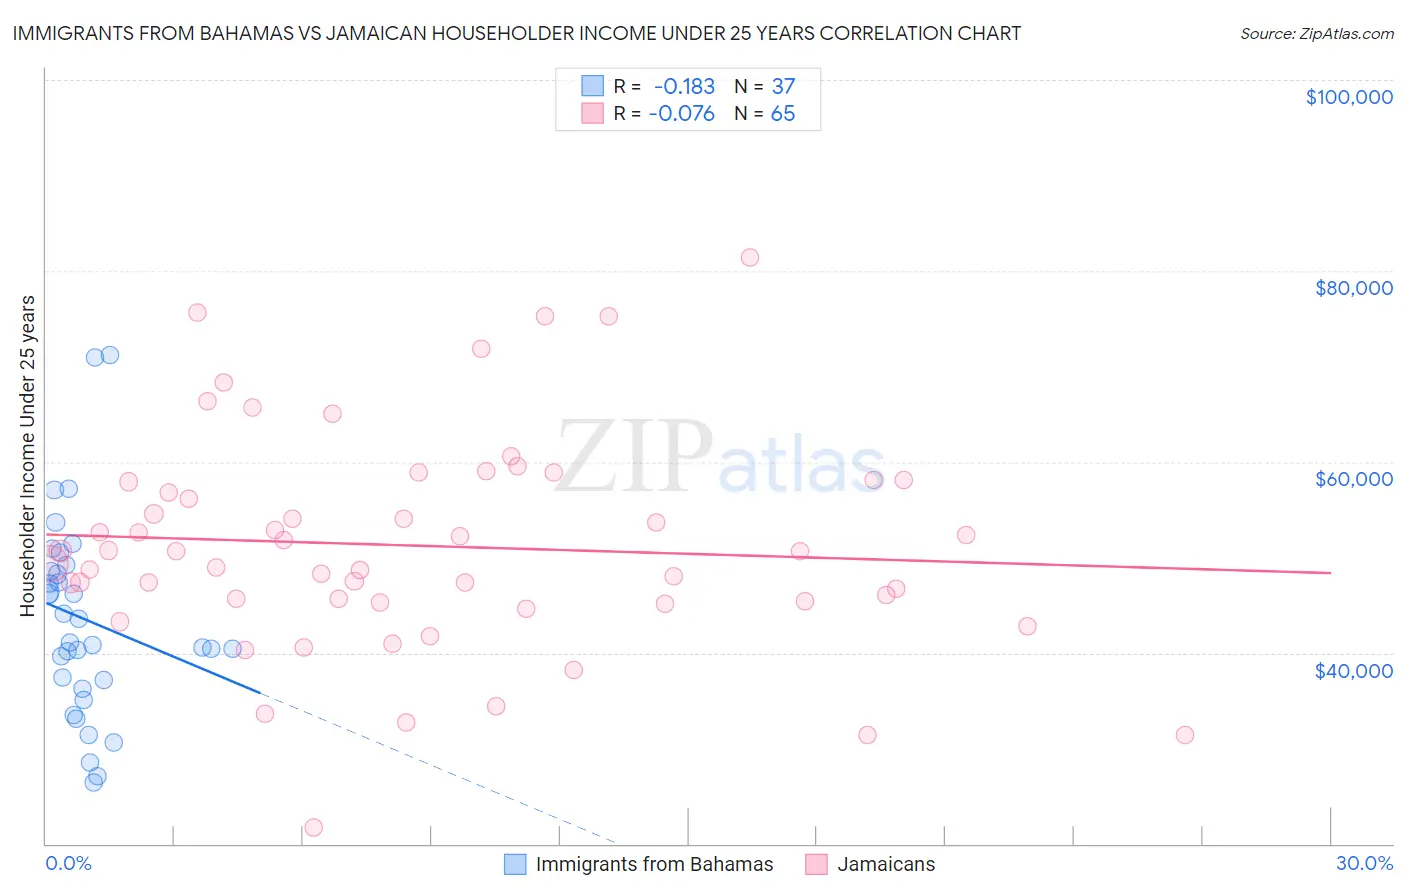
Immigrants from Bahamas vs Jamaican Householder Income Under 25 years Correlation Chart
The statistical analysis conducted on geographies consisting of 97,494,664 people shows a poor negative correlation between the proportion of Immigrants from Bahamas and household income with householder under the age of 25 in the United States with a correlation coefficient (R) of -0.183 and weighted average of $45,793. Similarly, the statistical analysis conducted on geographies consisting of 311,962,738 people shows a slight negative correlation between the proportion of Jamaicans and household income with householder under the age of 25 in the United States with a correlation coefficient (R) of -0.076 and weighted average of $50,929, a difference of 11.2%.
Householder Income Under 25 years Correlation Summary
| Measurement | Immigrants from Bahamas | Jamaican |
| Minimum | $26,418 | $21,667 |
| Maximum | $71,250 | $81,354 |
| Range | $44,832 | $59,687 |
| Mean | $43,510 | $51,206 |
| Median | $41,087 | $50,597 |
| Interquartile 25% (IQ1) | $36,692 | $45,297 |
| Interquartile 75% (IQ3) | $48,889 | $58,010 |
| Interquartile Range (IQR) | $12,196 | $12,713 |
| Standard Deviation (Sample) | $10,378 | $11,380 |
| Standard Deviation (Population) | $10,237 | $11,292 |
Similar Demographics by Householder Income Under 25 years
Demographics Similar to Immigrants from Bahamas by Householder Income Under 25 years
In terms of householder income under 25 years, the demographic groups most similar to Immigrants from Bahamas are Dutch West Indian ($45,816, a difference of 0.050%), Osage ($45,764, a difference of 0.060%), Bahamian ($45,743, a difference of 0.11%), German Russian ($45,673, a difference of 0.26%), and Seminole ($45,649, a difference of 0.32%).
| Demographics | Rating | Rank | Householder Income Under 25 years |
| Spanish Americans | 0.0 /100 | #318 | Tragic $46,913 |
| Africans | 0.0 /100 | #319 | Tragic $46,838 |
| Immigrants | Sudan | 0.0 /100 | #320 | Tragic $46,791 |
| Potawatomi | 0.0 /100 | #321 | Tragic $46,462 |
| Sioux | 0.0 /100 | #322 | Tragic $46,417 |
| Immigrants | Saudi Arabia | 0.0 /100 | #323 | Tragic $46,187 |
| Dutch West Indians | 0.0 /100 | #324 | Tragic $45,816 |
| Immigrants | Bahamas | 0.0 /100 | #325 | Tragic $45,793 |
| Osage | 0.0 /100 | #326 | Tragic $45,764 |
| Bahamians | 0.0 /100 | #327 | Tragic $45,743 |
| German Russians | 0.0 /100 | #328 | Tragic $45,673 |
| Seminole | 0.0 /100 | #329 | Tragic $45,649 |
| Indonesians | 0.0 /100 | #330 | Tragic $45,566 |
| Immigrants | Zaire | 0.0 /100 | #331 | Tragic $45,529 |
| Choctaw | 0.0 /100 | #332 | Tragic $45,450 |
Demographics Similar to Jamaicans by Householder Income Under 25 years
In terms of householder income under 25 years, the demographic groups most similar to Jamaicans are Yuman ($50,933, a difference of 0.010%), Ugandan ($50,923, a difference of 0.010%), Slovene ($50,886, a difference of 0.080%), Immigrants from Norway ($50,984, a difference of 0.11%), and Pennsylvania German ($50,852, a difference of 0.15%).
| Demographics | Rating | Rank | Householder Income Under 25 years |
| Serbians | 6.6 /100 | #223 | Tragic $51,106 |
| Belizeans | 6.4 /100 | #224 | Tragic $51,094 |
| Immigrants | Jamaica | 5.6 /100 | #225 | Tragic $51,038 |
| Yugoslavians | 5.5 /100 | #226 | Tragic $51,028 |
| Immigrants | Central America | 5.4 /100 | #227 | Tragic $51,022 |
| Immigrants | Norway | 5.0 /100 | #228 | Tragic $50,984 |
| Yuman | 4.4 /100 | #229 | Tragic $50,933 |
| Jamaicans | 4.4 /100 | #230 | Tragic $50,929 |
| Ugandans | 4.3 /100 | #231 | Tragic $50,923 |
| Slovenes | 4.0 /100 | #232 | Tragic $50,886 |
| Pennsylvania Germans | 3.7 /100 | #233 | Tragic $50,852 |
| Kenyans | 3.3 /100 | #234 | Tragic $50,815 |
| Spanish | 3.3 /100 | #235 | Tragic $50,813 |
| English | 3.3 /100 | #236 | Tragic $50,805 |
| Germans | 3.3 /100 | #237 | Tragic $50,804 |