Immigrants from Panama vs Barbadian Median Family Income
COMPARE
Immigrants from Panama
Barbadian
Median Family Income
Median Family Income Comparison
Immigrants from Panama
Barbadians
$95,647
MEDIAN FAMILY INCOME
2.7/ 100
METRIC RATING
226th/ 347
METRIC RANK
$93,919
MEDIAN FAMILY INCOME
1.1/ 100
METRIC RATING
242nd/ 347
METRIC RANK
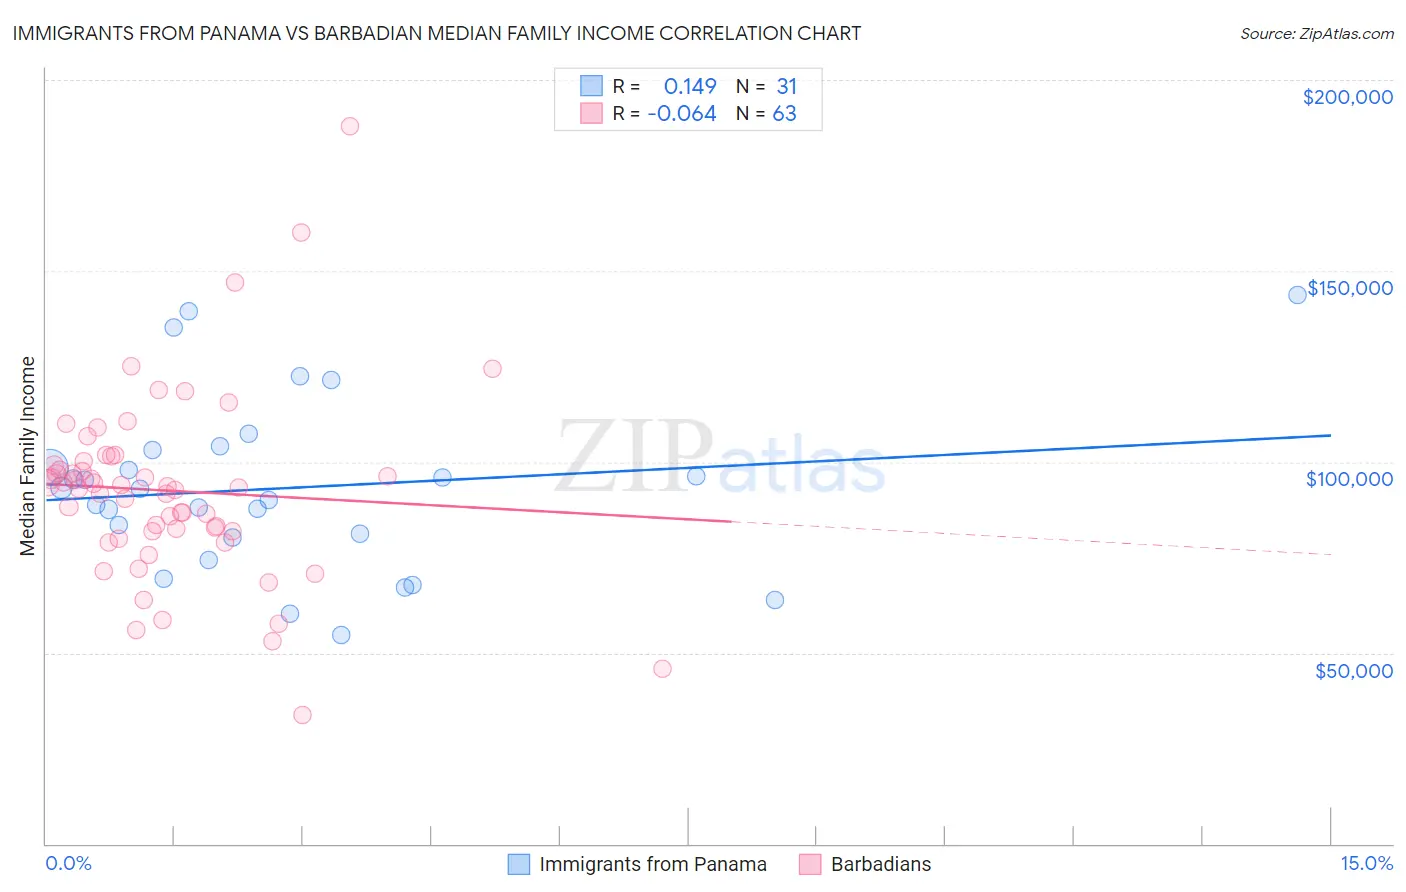
Immigrants from Panama vs Barbadian Median Family Income Correlation Chart
The statistical analysis conducted on geographies consisting of 221,145,724 people shows a poor positive correlation between the proportion of Immigrants from Panama and median family income in the United States with a correlation coefficient (R) of 0.149 and weighted average of $95,647. Similarly, the statistical analysis conducted on geographies consisting of 141,221,123 people shows a slight negative correlation between the proportion of Barbadians and median family income in the United States with a correlation coefficient (R) of -0.064 and weighted average of $93,919, a difference of 1.8%.
Median Family Income Correlation Summary
| Measurement | Immigrants from Panama | Barbadian |
| Minimum | $54,583 | $33,750 |
| Maximum | $143,854 | $188,047 |
| Range | $89,271 | $154,297 |
| Mean | $93,119 | $92,437 |
| Median | $92,830 | $93,405 |
| Interquartile 25% (IQ1) | $80,245 | $81,674 |
| Interquartile 75% (IQ3) | $103,110 | $100,271 |
| Interquartile Range (IQR) | $22,865 | $18,597 |
| Standard Deviation (Sample) | $22,241 | $24,591 |
| Standard Deviation (Population) | $21,880 | $24,395 |
Demographics Similar to Immigrants from Panama and Barbadians by Median Family Income
In terms of median family income, the demographic groups most similar to Immigrants from Panama are Alaska Native ($95,573, a difference of 0.080%), Immigrants from the Azores ($95,402, a difference of 0.26%), Marshallese ($95,293, a difference of 0.37%), Malaysian ($95,230, a difference of 0.44%), and Vietnamese ($96,123, a difference of 0.50%). Similarly, the demographic groups most similar to Barbadians are German Russian ($93,858, a difference of 0.060%), Immigrants from Trinidad and Tobago ($93,988, a difference of 0.070%), Somali ($94,085, a difference of 0.18%), Subsaharan African ($93,748, a difference of 0.18%), and Salvadoran ($94,109, a difference of 0.20%).
| Demographics | Rating | Rank | Median Family Income |
| Immigrants | Nonimmigrants | 3.6 /100 | #224 | Tragic $96,231 |
| Vietnamese | 3.4 /100 | #225 | Tragic $96,123 |
| Immigrants | Panama | 2.7 /100 | #226 | Tragic $95,647 |
| Alaska Natives | 2.6 /100 | #227 | Tragic $95,573 |
| Immigrants | Azores | 2.4 /100 | #228 | Tragic $95,402 |
| Marshallese | 2.2 /100 | #229 | Tragic $95,293 |
| Malaysians | 2.2 /100 | #230 | Tragic $95,230 |
| Ecuadorians | 2.1 /100 | #231 | Tragic $95,114 |
| Immigrants | Venezuela | 1.9 /100 | #232 | Tragic $94,904 |
| Immigrants | Bangladesh | 1.6 /100 | #233 | Tragic $94,665 |
| Immigrants | Western Africa | 1.6 /100 | #234 | Tragic $94,638 |
| Immigrants | Burma/Myanmar | 1.5 /100 | #235 | Tragic $94,472 |
| Trinidadians and Tobagonians | 1.5 /100 | #236 | Tragic $94,466 |
| Alaskan Athabascans | 1.5 /100 | #237 | Tragic $94,429 |
| Nepalese | 1.3 /100 | #238 | Tragic $94,153 |
| Salvadorans | 1.2 /100 | #239 | Tragic $94,109 |
| Somalis | 1.2 /100 | #240 | Tragic $94,085 |
| Immigrants | Trinidad and Tobago | 1.2 /100 | #241 | Tragic $93,988 |
| Barbadians | 1.1 /100 | #242 | Tragic $93,919 |
| German Russians | 1.1 /100 | #243 | Tragic $93,858 |
| Sub-Saharan Africans | 1.0 /100 | #244 | Tragic $93,748 |