Immigrants from Argentina vs Immigrants from Venezuela Householder Income Ages 25 - 44 years
COMPARE
Immigrants from Argentina
Immigrants from Venezuela
Householder Income Ages 25 - 44 years
Householder Income Ages 25 - 44 years Comparison
Immigrants from Argentina
Immigrants from Venezuela
$101,415
HOUSEHOLDER INCOME AGES 25 - 44 YEARS
97.8/ 100
METRIC RATING
100th/ 347
METRIC RANK
$87,038
HOUSEHOLDER INCOME AGES 25 - 44 YEARS
1.5/ 100
METRIC RATING
244th/ 347
METRIC RANK
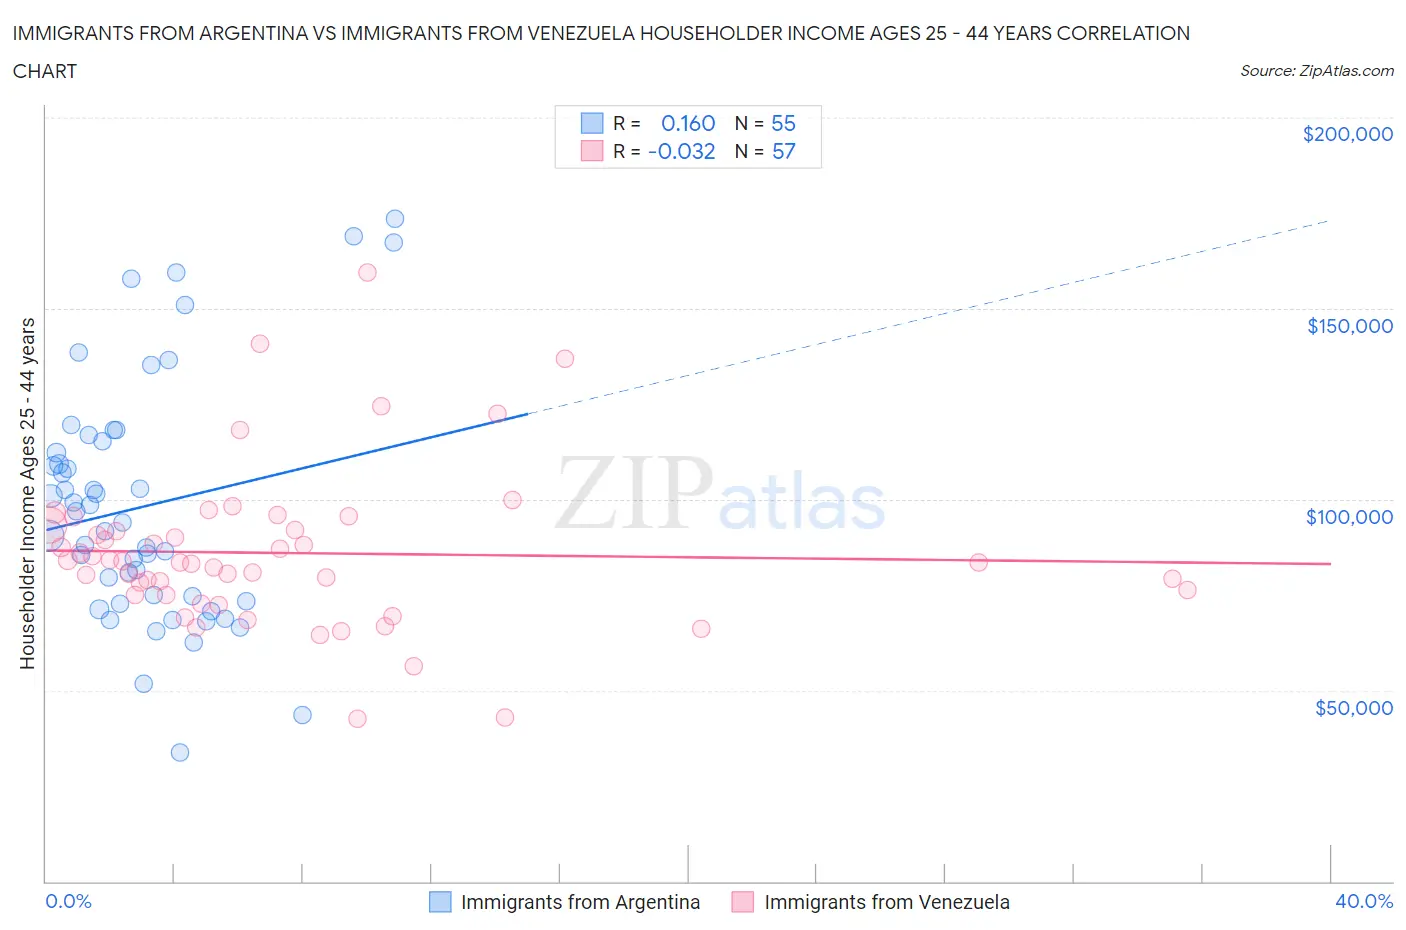
Immigrants from Argentina vs Immigrants from Venezuela Householder Income Ages 25 - 44 years Correlation Chart
The statistical analysis conducted on geographies consisting of 264,114,955 people shows a poor positive correlation between the proportion of Immigrants from Argentina and household income with householder between the ages 25 and 44 in the United States with a correlation coefficient (R) of 0.160 and weighted average of $101,415. Similarly, the statistical analysis conducted on geographies consisting of 287,593,793 people shows no correlation between the proportion of Immigrants from Venezuela and household income with householder between the ages 25 and 44 in the United States with a correlation coefficient (R) of -0.032 and weighted average of $87,038, a difference of 16.5%.
Householder Income Ages 25 - 44 years Correlation Summary
| Measurement | Immigrants from Argentina | Immigrants from Venezuela |
| Minimum | $33,750 | $42,682 |
| Maximum | $173,409 | $159,302 |
| Range | $139,659 | $116,620 |
| Mean | $98,084 | $85,948 |
| Median | $93,801 | $83,506 |
| Interquartile 25% (IQ1) | $73,173 | $74,951 |
| Interquartile 75% (IQ3) | $115,092 | $92,632 |
| Interquartile Range (IQR) | $41,919 | $17,681 |
| Standard Deviation (Sample) | $31,751 | $20,900 |
| Standard Deviation (Population) | $31,461 | $20,716 |
Similar Demographics by Householder Income Ages 25 - 44 years
Demographics Similar to Immigrants from Argentina by Householder Income Ages 25 - 44 years
In terms of householder income ages 25 - 44 years, the demographic groups most similar to Immigrants from Argentina are Albanian ($101,367, a difference of 0.050%), Taiwanese ($101,492, a difference of 0.080%), Immigrants from Lebanon ($101,124, a difference of 0.29%), Immigrants from Kazakhstan ($101,727, a difference of 0.31%), and Immigrants from Moldova ($101,091, a difference of 0.32%).
| Demographics | Rating | Rank | Householder Income Ages 25 - 44 years |
| Immigrants | England | 98.4 /100 | #93 | Exceptional $102,020 |
| Sri Lankans | 98.4 /100 | #94 | Exceptional $101,960 |
| Assyrians/Chaldeans/Syriacs | 98.3 /100 | #95 | Exceptional $101,936 |
| Macedonians | 98.3 /100 | #96 | Exceptional $101,882 |
| Austrians | 98.3 /100 | #97 | Exceptional $101,842 |
| Immigrants | Kazakhstan | 98.1 /100 | #98 | Exceptional $101,727 |
| Taiwanese | 97.9 /100 | #99 | Exceptional $101,492 |
| Immigrants | Argentina | 97.8 /100 | #100 | Exceptional $101,415 |
| Albanians | 97.8 /100 | #101 | Exceptional $101,367 |
| Immigrants | Lebanon | 97.4 /100 | #102 | Exceptional $101,124 |
| Immigrants | Moldova | 97.4 /100 | #103 | Exceptional $101,091 |
| Immigrants | Poland | 97.4 /100 | #104 | Exceptional $101,065 |
| Immigrants | Vietnam | 96.5 /100 | #105 | Exceptional $100,535 |
| Immigrants | Brazil | 96.5 /100 | #106 | Exceptional $100,534 |
| Northern Europeans | 96.3 /100 | #107 | Exceptional $100,457 |
Demographics Similar to Immigrants from Venezuela by Householder Income Ages 25 - 44 years
In terms of householder income ages 25 - 44 years, the demographic groups most similar to Immigrants from Venezuela are Immigrants from West Indies ($87,063, a difference of 0.030%), Immigrants from El Salvador ($86,913, a difference of 0.14%), West Indian ($87,205, a difference of 0.19%), Immigrants from Burma/Myanmar ($86,736, a difference of 0.35%), and Immigrants from Nigeria ($86,589, a difference of 0.52%).
| Demographics | Rating | Rank | Householder Income Ages 25 - 44 years |
| Salvadorans | 2.8 /100 | #237 | Tragic $88,198 |
| Alaska Natives | 2.6 /100 | #238 | Tragic $88,018 |
| Immigrants | Ghana | 2.2 /100 | #239 | Tragic $87,760 |
| Nicaraguans | 2.2 /100 | #240 | Tragic $87,751 |
| Nigerians | 2.2 /100 | #241 | Tragic $87,730 |
| West Indians | 1.7 /100 | #242 | Tragic $87,205 |
| Immigrants | West Indies | 1.5 /100 | #243 | Tragic $87,063 |
| Immigrants | Venezuela | 1.5 /100 | #244 | Tragic $87,038 |
| Immigrants | El Salvador | 1.4 /100 | #245 | Tragic $86,913 |
| Immigrants | Burma/Myanmar | 1.3 /100 | #246 | Tragic $86,736 |
| Immigrants | Nigeria | 1.2 /100 | #247 | Tragic $86,589 |
| Immigrants | Sudan | 0.9 /100 | #248 | Tragic $86,109 |
| French American Indians | 0.8 /100 | #249 | Tragic $85,899 |
| Pennsylvania Germans | 0.8 /100 | #250 | Tragic $85,836 |
| Cape Verdeans | 0.8 /100 | #251 | Tragic $85,758 |