Immigrants from Argentina vs Liberian Householder Income Ages 25 - 44 years
COMPARE
Immigrants from Argentina
Liberian
Householder Income Ages 25 - 44 years
Householder Income Ages 25 - 44 years Comparison
Immigrants from Argentina
Liberians
$101,415
HOUSEHOLDER INCOME AGES 25 - 44 YEARS
97.8/ 100
METRIC RATING
100th/ 347
METRIC RANK
$82,005
HOUSEHOLDER INCOME AGES 25 - 44 YEARS
0.1/ 100
METRIC RATING
290th/ 347
METRIC RANK
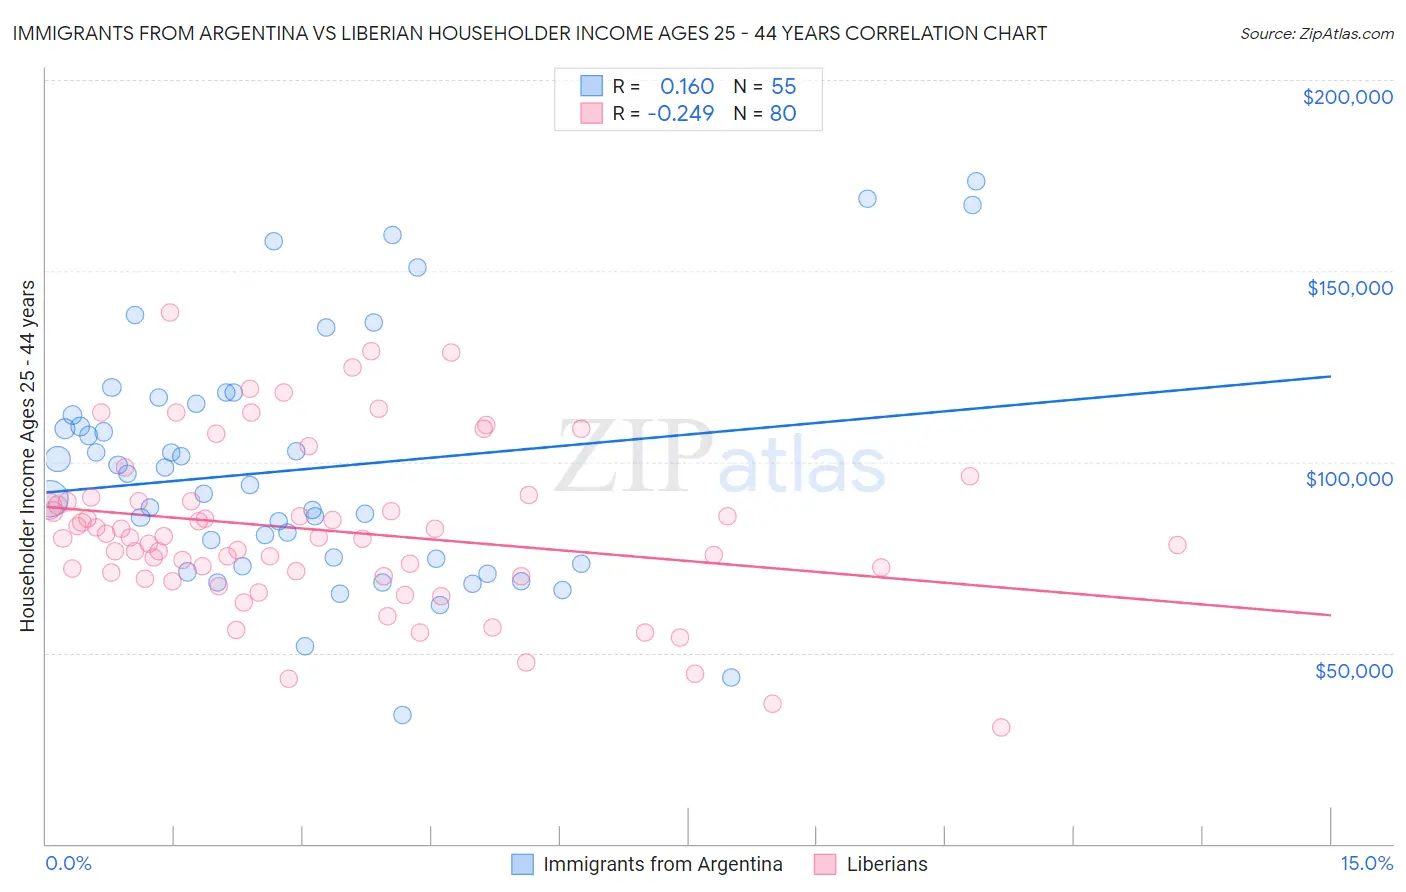
Immigrants from Argentina vs Liberian Householder Income Ages 25 - 44 years Correlation Chart
The statistical analysis conducted on geographies consisting of 264,114,955 people shows a poor positive correlation between the proportion of Immigrants from Argentina and household income with householder between the ages 25 and 44 in the United States with a correlation coefficient (R) of 0.160 and weighted average of $101,415. Similarly, the statistical analysis conducted on geographies consisting of 117,996,712 people shows a weak negative correlation between the proportion of Liberians and household income with householder between the ages 25 and 44 in the United States with a correlation coefficient (R) of -0.249 and weighted average of $82,005, a difference of 23.7%.
Householder Income Ages 25 - 44 years Correlation Summary
| Measurement | Immigrants from Argentina | Liberian |
| Minimum | $33,750 | $30,517 |
| Maximum | $173,409 | $139,167 |
| Range | $139,659 | $108,650 |
| Mean | $98,084 | $82,112 |
| Median | $93,801 | $80,107 |
| Interquartile 25% (IQ1) | $73,173 | $70,490 |
| Interquartile 75% (IQ3) | $115,092 | $89,678 |
| Interquartile Range (IQR) | $41,919 | $19,188 |
| Standard Deviation (Sample) | $31,751 | $21,404 |
| Standard Deviation (Population) | $31,461 | $21,270 |
Similar Demographics by Householder Income Ages 25 - 44 years
Demographics Similar to Immigrants from Argentina by Householder Income Ages 25 - 44 years
In terms of householder income ages 25 - 44 years, the demographic groups most similar to Immigrants from Argentina are Albanian ($101,367, a difference of 0.050%), Taiwanese ($101,492, a difference of 0.080%), Immigrants from Lebanon ($101,124, a difference of 0.29%), Immigrants from Kazakhstan ($101,727, a difference of 0.31%), and Immigrants from Moldova ($101,091, a difference of 0.32%).
| Demographics | Rating | Rank | Householder Income Ages 25 - 44 years |
| Immigrants | England | 98.4 /100 | #93 | Exceptional $102,020 |
| Sri Lankans | 98.4 /100 | #94 | Exceptional $101,960 |
| Assyrians/Chaldeans/Syriacs | 98.3 /100 | #95 | Exceptional $101,936 |
| Macedonians | 98.3 /100 | #96 | Exceptional $101,882 |
| Austrians | 98.3 /100 | #97 | Exceptional $101,842 |
| Immigrants | Kazakhstan | 98.1 /100 | #98 | Exceptional $101,727 |
| Taiwanese | 97.9 /100 | #99 | Exceptional $101,492 |
| Immigrants | Argentina | 97.8 /100 | #100 | Exceptional $101,415 |
| Albanians | 97.8 /100 | #101 | Exceptional $101,367 |
| Immigrants | Lebanon | 97.4 /100 | #102 | Exceptional $101,124 |
| Immigrants | Moldova | 97.4 /100 | #103 | Exceptional $101,091 |
| Immigrants | Poland | 97.4 /100 | #104 | Exceptional $101,065 |
| Immigrants | Vietnam | 96.5 /100 | #105 | Exceptional $100,535 |
| Immigrants | Brazil | 96.5 /100 | #106 | Exceptional $100,534 |
| Northern Europeans | 96.3 /100 | #107 | Exceptional $100,457 |
Demographics Similar to Liberians by Householder Income Ages 25 - 44 years
In terms of householder income ages 25 - 44 years, the demographic groups most similar to Liberians are Shoshone ($82,062, a difference of 0.070%), Comanche ($82,152, a difference of 0.18%), Ute ($82,166, a difference of 0.20%), Immigrants from Latin America ($82,166, a difference of 0.20%), and Immigrants from Somalia ($82,188, a difference of 0.22%).
| Demographics | Rating | Rank | Householder Income Ages 25 - 44 years |
| Guatemalans | 0.1 /100 | #283 | Tragic $82,331 |
| Immigrants | Middle Africa | 0.1 /100 | #284 | Tragic $82,254 |
| Immigrants | Somalia | 0.1 /100 | #285 | Tragic $82,188 |
| Ute | 0.1 /100 | #286 | Tragic $82,166 |
| Immigrants | Latin America | 0.1 /100 | #287 | Tragic $82,166 |
| Comanche | 0.1 /100 | #288 | Tragic $82,152 |
| Shoshone | 0.1 /100 | #289 | Tragic $82,062 |
| Liberians | 0.1 /100 | #290 | Tragic $82,005 |
| Potawatomi | 0.1 /100 | #291 | Tragic $81,774 |
| Yaqui | 0.1 /100 | #292 | Tragic $81,656 |
| Blackfeet | 0.1 /100 | #293 | Tragic $81,531 |
| Cubans | 0.1 /100 | #294 | Tragic $81,483 |
| Bangladeshis | 0.1 /100 | #295 | Tragic $81,363 |
| Immigrants | Dominica | 0.1 /100 | #296 | Tragic $81,351 |
| Immigrants | Guatemala | 0.1 /100 | #297 | Tragic $81,341 |