Immigrants from Argentina vs Iroquois Householder Income Ages 25 - 44 years
COMPARE
Immigrants from Argentina
Iroquois
Householder Income Ages 25 - 44 years
Householder Income Ages 25 - 44 years Comparison
Immigrants from Argentina
Iroquois
$101,415
HOUSEHOLDER INCOME AGES 25 - 44 YEARS
97.8/ 100
METRIC RATING
100th/ 347
METRIC RANK
$83,682
HOUSEHOLDER INCOME AGES 25 - 44 YEARS
0.2/ 100
METRIC RATING
273rd/ 347
METRIC RANK
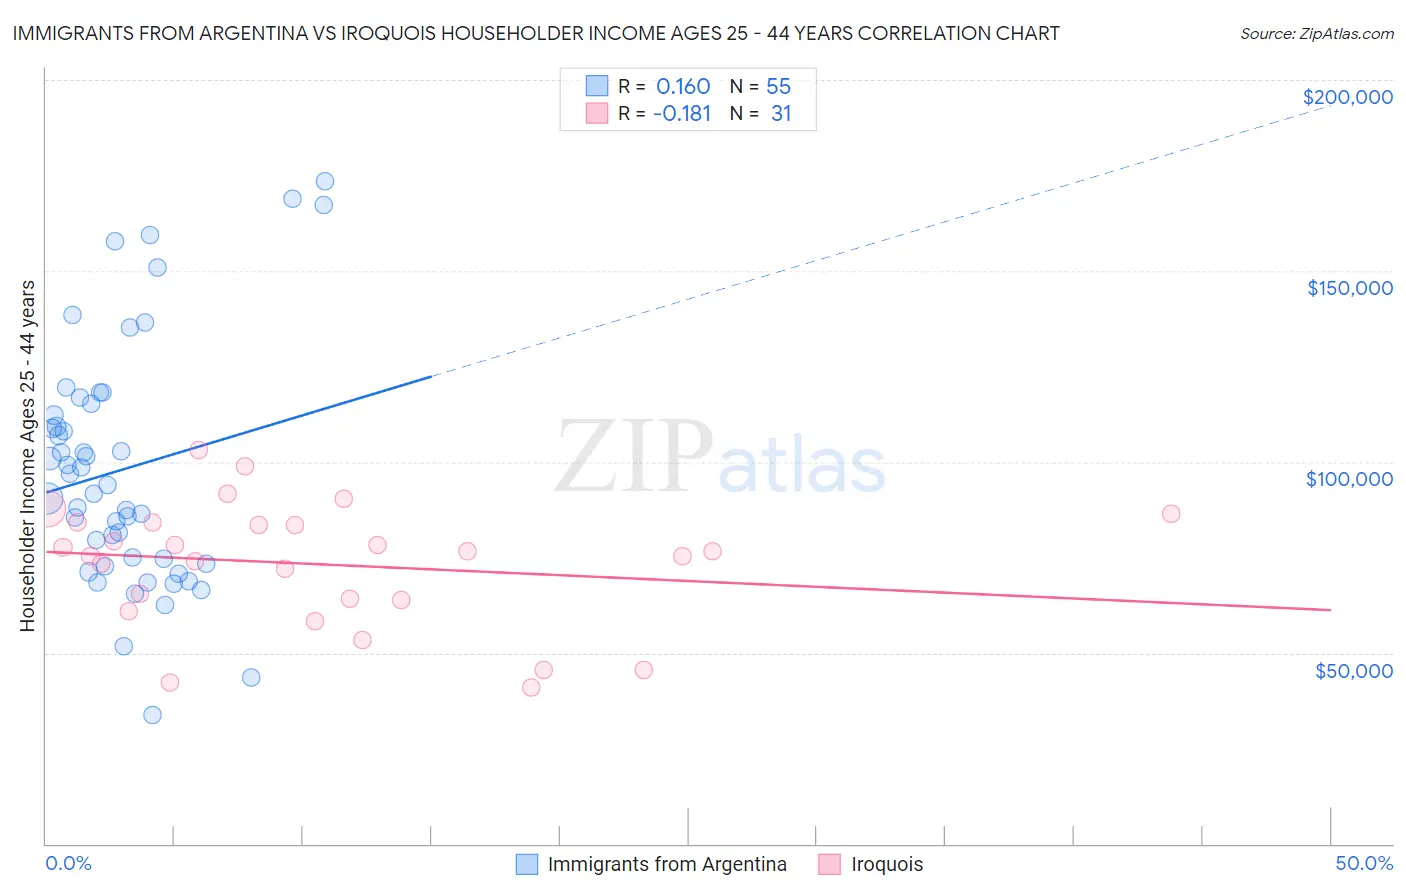
Immigrants from Argentina vs Iroquois Householder Income Ages 25 - 44 years Correlation Chart
The statistical analysis conducted on geographies consisting of 264,114,955 people shows a poor positive correlation between the proportion of Immigrants from Argentina and household income with householder between the ages 25 and 44 in the United States with a correlation coefficient (R) of 0.160 and weighted average of $101,415. Similarly, the statistical analysis conducted on geographies consisting of 207,014,213 people shows a poor negative correlation between the proportion of Iroquois and household income with householder between the ages 25 and 44 in the United States with a correlation coefficient (R) of -0.181 and weighted average of $83,682, a difference of 21.2%.
Householder Income Ages 25 - 44 years Correlation Summary
| Measurement | Immigrants from Argentina | Iroquois |
| Minimum | $33,750 | $40,878 |
| Maximum | $173,409 | $102,951 |
| Range | $139,659 | $62,073 |
| Mean | $98,084 | $73,208 |
| Median | $93,801 | $76,438 |
| Interquartile 25% (IQ1) | $73,173 | $63,949 |
| Interquartile 75% (IQ3) | $115,092 | $84,029 |
| Interquartile Range (IQR) | $41,919 | $20,079 |
| Standard Deviation (Sample) | $31,751 | $16,006 |
| Standard Deviation (Population) | $31,461 | $15,746 |
Similar Demographics by Householder Income Ages 25 - 44 years
Demographics Similar to Immigrants from Argentina by Householder Income Ages 25 - 44 years
In terms of householder income ages 25 - 44 years, the demographic groups most similar to Immigrants from Argentina are Albanian ($101,367, a difference of 0.050%), Taiwanese ($101,492, a difference of 0.080%), Immigrants from Lebanon ($101,124, a difference of 0.29%), Immigrants from Kazakhstan ($101,727, a difference of 0.31%), and Immigrants from Moldova ($101,091, a difference of 0.32%).
| Demographics | Rating | Rank | Householder Income Ages 25 - 44 years |
| Immigrants | England | 98.4 /100 | #93 | Exceptional $102,020 |
| Sri Lankans | 98.4 /100 | #94 | Exceptional $101,960 |
| Assyrians/Chaldeans/Syriacs | 98.3 /100 | #95 | Exceptional $101,936 |
| Macedonians | 98.3 /100 | #96 | Exceptional $101,882 |
| Austrians | 98.3 /100 | #97 | Exceptional $101,842 |
| Immigrants | Kazakhstan | 98.1 /100 | #98 | Exceptional $101,727 |
| Taiwanese | 97.9 /100 | #99 | Exceptional $101,492 |
| Immigrants | Argentina | 97.8 /100 | #100 | Exceptional $101,415 |
| Albanians | 97.8 /100 | #101 | Exceptional $101,367 |
| Immigrants | Lebanon | 97.4 /100 | #102 | Exceptional $101,124 |
| Immigrants | Moldova | 97.4 /100 | #103 | Exceptional $101,091 |
| Immigrants | Poland | 97.4 /100 | #104 | Exceptional $101,065 |
| Immigrants | Vietnam | 96.5 /100 | #105 | Exceptional $100,535 |
| Immigrants | Brazil | 96.5 /100 | #106 | Exceptional $100,534 |
| Northern Europeans | 96.3 /100 | #107 | Exceptional $100,457 |
Demographics Similar to Iroquois by Householder Income Ages 25 - 44 years
In terms of householder income ages 25 - 44 years, the demographic groups most similar to Iroquois are Spanish American ($83,722, a difference of 0.050%), Somali ($83,752, a difference of 0.080%), Marshallese ($83,575, a difference of 0.13%), Jamaican ($83,933, a difference of 0.30%), and Immigrants from Jamaica ($83,298, a difference of 0.46%).
| Demographics | Rating | Rank | Householder Income Ages 25 - 44 years |
| Immigrants | Cabo Verde | 0.3 /100 | #266 | Tragic $84,304 |
| Hmong | 0.3 /100 | #267 | Tragic $84,258 |
| Sub-Saharan Africans | 0.3 /100 | #268 | Tragic $84,235 |
| Spanish American Indians | 0.3 /100 | #269 | Tragic $84,085 |
| Jamaicans | 0.3 /100 | #270 | Tragic $83,933 |
| Somalis | 0.2 /100 | #271 | Tragic $83,752 |
| Spanish Americans | 0.2 /100 | #272 | Tragic $83,722 |
| Iroquois | 0.2 /100 | #273 | Tragic $83,682 |
| Marshallese | 0.2 /100 | #274 | Tragic $83,575 |
| Immigrants | Jamaica | 0.2 /100 | #275 | Tragic $83,298 |
| Immigrants | Belize | 0.2 /100 | #276 | Tragic $83,141 |
| Paiute | 0.2 /100 | #277 | Tragic $82,984 |
| Senegalese | 0.2 /100 | #278 | Tragic $82,852 |
| Pima | 0.1 /100 | #279 | Tragic $82,821 |
| Colville | 0.1 /100 | #280 | Tragic $82,604 |