Immigrants from Albania vs Immigrants from Western Europe Householder Income Under 25 years
COMPARE
Immigrants from Albania
Immigrants from Western Europe
Householder Income Under 25 years
Householder Income Under 25 years Comparison
Immigrants from Albania
Immigrants from Western Europe
$53,597
HOUSEHOLDER INCOME UNDER 25 YEARS
96.9/ 100
METRIC RATING
115th/ 347
METRIC RANK
$52,957
HOUSEHOLDER INCOME UNDER 25 YEARS
86.7/ 100
METRIC RATING
145th/ 347
METRIC RANK
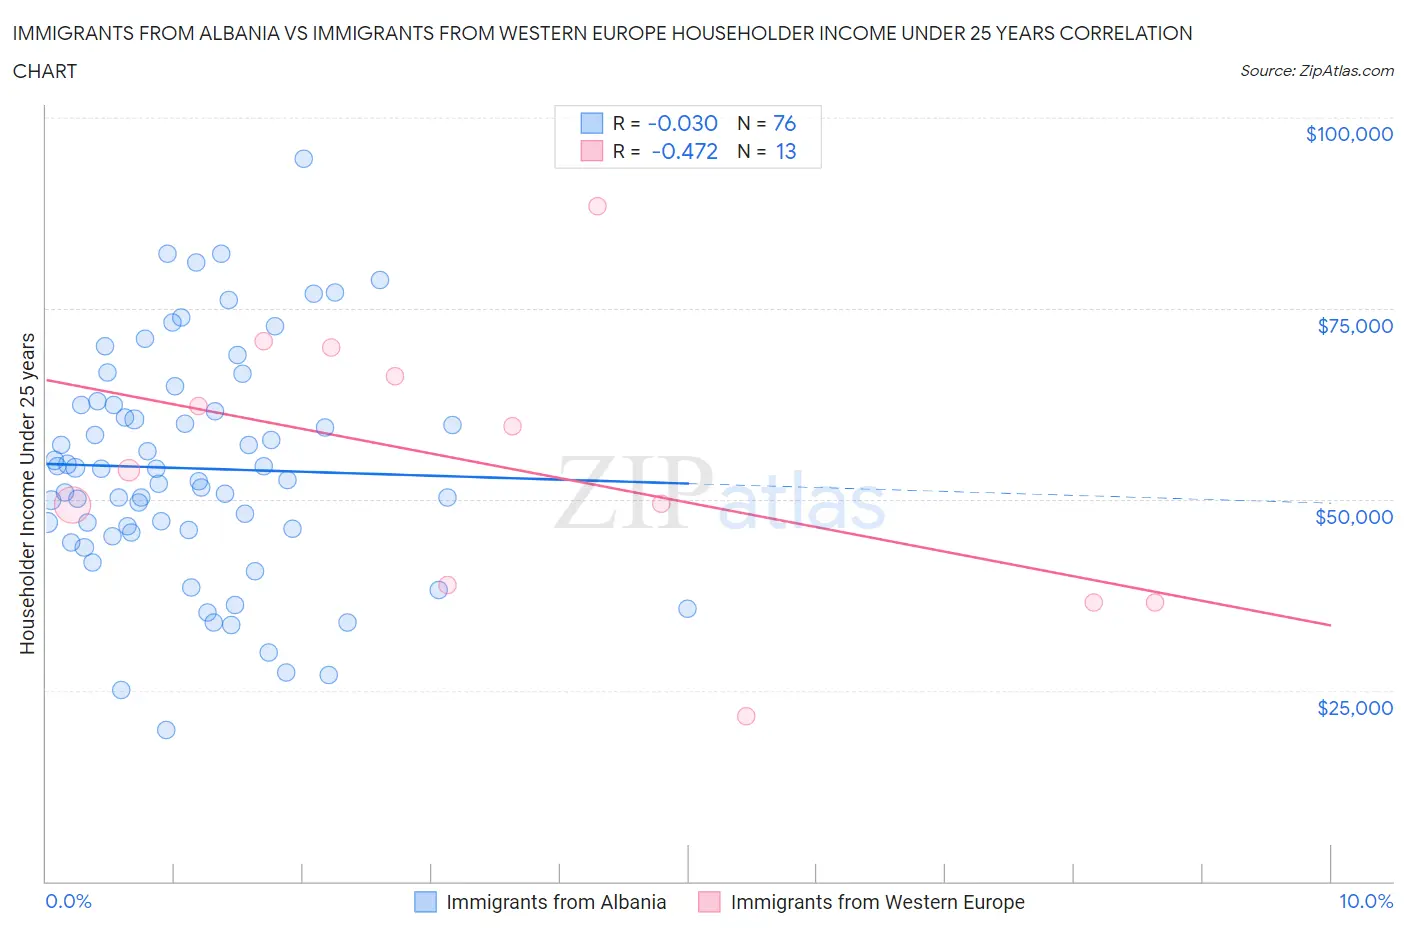
Immigrants from Albania vs Immigrants from Western Europe Householder Income Under 25 years Correlation Chart
The statistical analysis conducted on geographies consisting of 107,044,611 people shows no correlation between the proportion of Immigrants from Albania and household income with householder under the age of 25 in the United States with a correlation coefficient (R) of -0.030 and weighted average of $53,597. Similarly, the statistical analysis conducted on geographies consisting of 400,852,129 people shows a moderate negative correlation between the proportion of Immigrants from Western Europe and household income with householder under the age of 25 in the United States with a correlation coefficient (R) of -0.472 and weighted average of $52,957, a difference of 1.2%.
Householder Income Under 25 years Correlation Summary
| Measurement | Immigrants from Albania | Immigrants from Western Europe |
| Minimum | $19,811 | $21,627 |
| Maximum | $94,545 | $88,400 |
| Range | $74,734 | $66,773 |
| Mean | $54,041 | $54,075 |
| Median | $53,274 | $53,818 |
| Interquartile 25% (IQ1) | $45,869 | $37,651 |
| Interquartile 75% (IQ3) | $62,406 | $68,022 |
| Interquartile Range (IQR) | $16,537 | $30,371 |
| Standard Deviation (Sample) | $14,993 | $18,027 |
| Standard Deviation (Population) | $14,894 | $17,320 |
Similar Demographics by Householder Income Under 25 years
Demographics Similar to Immigrants from Albania by Householder Income Under 25 years
In terms of householder income under 25 years, the demographic groups most similar to Immigrants from Albania are Immigrants from Sweden ($53,621, a difference of 0.040%), Romanian ($53,632, a difference of 0.070%), Immigrants from Spain ($53,560, a difference of 0.070%), Lithuanian ($53,552, a difference of 0.080%), and Immigrants from Switzerland ($53,528, a difference of 0.13%).
| Demographics | Rating | Rank | Householder Income Under 25 years |
| Maltese | 97.8 /100 | #108 | Exceptional $53,735 |
| Immigrants | Ecuador | 97.7 /100 | #109 | Exceptional $53,722 |
| Greeks | 97.7 /100 | #110 | Exceptional $53,715 |
| Immigrants | Colombia | 97.7 /100 | #111 | Exceptional $53,714 |
| Immigrants | Oceania | 97.5 /100 | #112 | Exceptional $53,680 |
| Romanians | 97.2 /100 | #113 | Exceptional $53,632 |
| Immigrants | Sweden | 97.1 /100 | #114 | Exceptional $53,621 |
| Immigrants | Albania | 96.9 /100 | #115 | Exceptional $53,597 |
| Immigrants | Spain | 96.6 /100 | #116 | Exceptional $53,560 |
| Lithuanians | 96.6 /100 | #117 | Exceptional $53,552 |
| Immigrants | Switzerland | 96.3 /100 | #118 | Exceptional $53,528 |
| Italians | 95.4 /100 | #119 | Exceptional $53,426 |
| Guamanians/Chamorros | 95.3 /100 | #120 | Exceptional $53,423 |
| Immigrants | Canada | 95.2 /100 | #121 | Exceptional $53,411 |
| Immigrants | Ethiopia | 95.2 /100 | #122 | Exceptional $53,408 |
Demographics Similar to Immigrants from Western Europe by Householder Income Under 25 years
In terms of householder income under 25 years, the demographic groups most similar to Immigrants from Western Europe are South American Indian ($52,979, a difference of 0.040%), Immigrants from Armenia ($52,986, a difference of 0.050%), Swedish ($52,986, a difference of 0.050%), Danish ($53,041, a difference of 0.16%), and Hawaiian ($53,078, a difference of 0.23%).
| Demographics | Rating | Rank | Householder Income Under 25 years |
| Norwegians | 90.8 /100 | #138 | Exceptional $53,127 |
| Costa Ricans | 90.4 /100 | #139 | Exceptional $53,106 |
| Hawaiians | 89.8 /100 | #140 | Excellent $53,078 |
| Danes | 88.9 /100 | #141 | Excellent $53,041 |
| Immigrants | Armenia | 87.5 /100 | #142 | Excellent $52,986 |
| Swedes | 87.5 /100 | #143 | Excellent $52,986 |
| South American Indians | 87.3 /100 | #144 | Excellent $52,979 |
| Immigrants | Western Europe | 86.7 /100 | #145 | Excellent $52,957 |
| Immigrants | Hungary | 81.6 /100 | #146 | Excellent $52,798 |
| Latvians | 81.0 /100 | #147 | Excellent $52,783 |
| French Canadians | 76.5 /100 | #148 | Good $52,672 |
| Scandinavians | 75.7 /100 | #149 | Good $52,654 |
| Immigrants | Costa Rica | 75.2 /100 | #150 | Good $52,643 |
| Immigrants | Scotland | 75.0 /100 | #151 | Good $52,638 |
| Trinidadians and Tobagonians | 74.6 /100 | #152 | Good $52,631 |