Immigrants from Albania vs Immigrants from France Householder Income Under 25 years
COMPARE
Immigrants from Albania
Immigrants from France
Householder Income Under 25 years
Householder Income Under 25 years Comparison
Immigrants from Albania
Immigrants from France
$53,597
HOUSEHOLDER INCOME UNDER 25 YEARS
96.9/ 100
METRIC RATING
115th/ 347
METRIC RANK
$53,805
HOUSEHOLDER INCOME UNDER 25 YEARS
98.1/ 100
METRIC RATING
105th/ 347
METRIC RANK
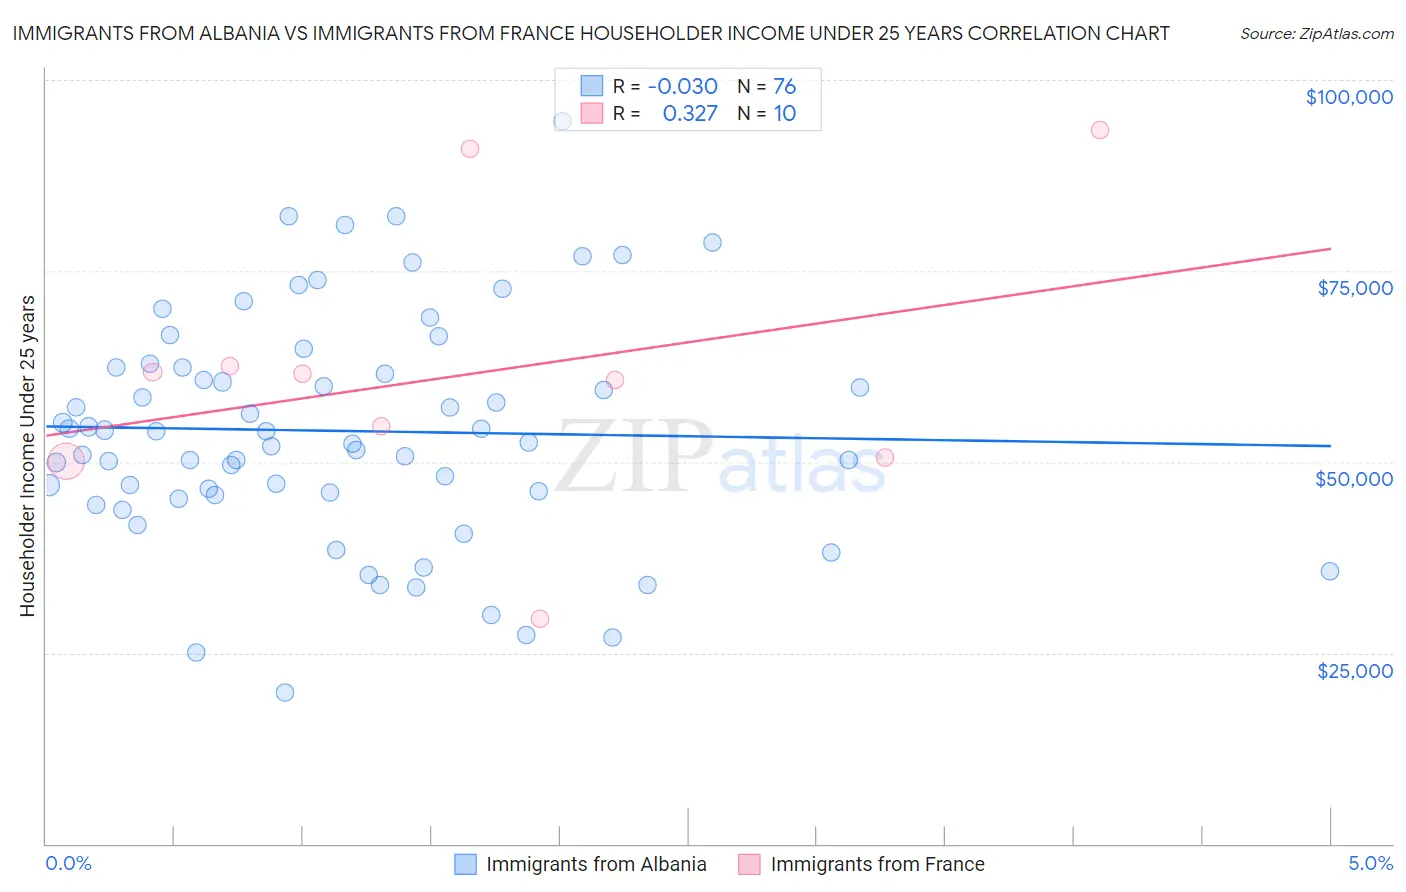
Immigrants from Albania vs Immigrants from France Householder Income Under 25 years Correlation Chart
The statistical analysis conducted on geographies consisting of 107,044,611 people shows no correlation between the proportion of Immigrants from Albania and household income with householder under the age of 25 in the United States with a correlation coefficient (R) of -0.030 and weighted average of $53,597. Similarly, the statistical analysis conducted on geographies consisting of 248,243,566 people shows a mild positive correlation between the proportion of Immigrants from France and household income with householder under the age of 25 in the United States with a correlation coefficient (R) of 0.327 and weighted average of $53,805, a difference of 0.39%.
Householder Income Under 25 years Correlation Summary
| Measurement | Immigrants from Albania | Immigrants from France |
| Minimum | $19,811 | $29,434 |
| Maximum | $94,545 | $93,438 |
| Range | $74,734 | $64,004 |
| Mean | $54,041 | $61,588 |
| Median | $53,274 | $61,120 |
| Interquartile 25% (IQ1) | $45,869 | $50,625 |
| Interquartile 75% (IQ3) | $62,406 | $62,574 |
| Interquartile Range (IQR) | $16,537 | $11,949 |
| Standard Deviation (Sample) | $14,993 | $18,901 |
| Standard Deviation (Population) | $14,894 | $17,931 |
Demographics Similar to Immigrants from Albania and Immigrants from France by Householder Income Under 25 years
In terms of householder income under 25 years, the demographic groups most similar to Immigrants from Albania are Immigrants from Sweden ($53,621, a difference of 0.040%), Romanian ($53,632, a difference of 0.070%), Immigrants from Spain ($53,560, a difference of 0.070%), Lithuanian ($53,552, a difference of 0.080%), and Immigrants from Switzerland ($53,528, a difference of 0.13%). Similarly, the demographic groups most similar to Immigrants from France are Ethiopian ($53,818, a difference of 0.020%), Albanian ($53,794, a difference of 0.020%), Ukrainian ($53,843, a difference of 0.070%), Australian ($53,739, a difference of 0.12%), and Maltese ($53,735, a difference of 0.13%).
| Demographics | Rating | Rank | Householder Income Under 25 years |
| Immigrants | Kazakhstan | 98.8 /100 | #100 | Exceptional $53,990 |
| South Americans | 98.6 /100 | #101 | Exceptional $53,939 |
| Ecuadorians | 98.5 /100 | #102 | Exceptional $53,911 |
| Ukrainians | 98.3 /100 | #103 | Exceptional $53,843 |
| Ethiopians | 98.2 /100 | #104 | Exceptional $53,818 |
| Immigrants | France | 98.1 /100 | #105 | Exceptional $53,805 |
| Albanians | 98.1 /100 | #106 | Exceptional $53,794 |
| Australians | 97.8 /100 | #107 | Exceptional $53,739 |
| Maltese | 97.8 /100 | #108 | Exceptional $53,735 |
| Immigrants | Ecuador | 97.7 /100 | #109 | Exceptional $53,722 |
| Greeks | 97.7 /100 | #110 | Exceptional $53,715 |
| Immigrants | Colombia | 97.7 /100 | #111 | Exceptional $53,714 |
| Immigrants | Oceania | 97.5 /100 | #112 | Exceptional $53,680 |
| Romanians | 97.2 /100 | #113 | Exceptional $53,632 |
| Immigrants | Sweden | 97.1 /100 | #114 | Exceptional $53,621 |
| Immigrants | Albania | 96.9 /100 | #115 | Exceptional $53,597 |
| Immigrants | Spain | 96.6 /100 | #116 | Exceptional $53,560 |
| Lithuanians | 96.6 /100 | #117 | Exceptional $53,552 |
| Immigrants | Switzerland | 96.3 /100 | #118 | Exceptional $53,528 |
| Italians | 95.4 /100 | #119 | Exceptional $53,426 |
| Guamanians/Chamorros | 95.3 /100 | #120 | Exceptional $53,423 |