Immigrants from Albania vs Immigrants from Sudan Householder Income Under 25 years
COMPARE
Immigrants from Albania
Immigrants from Sudan
Householder Income Under 25 years
Householder Income Under 25 years Comparison
Immigrants from Albania
Immigrants from Sudan
$53,597
HOUSEHOLDER INCOME UNDER 25 YEARS
96.9/ 100
METRIC RATING
115th/ 347
METRIC RANK
$46,791
HOUSEHOLDER INCOME UNDER 25 YEARS
0.0/ 100
METRIC RATING
320th/ 347
METRIC RANK
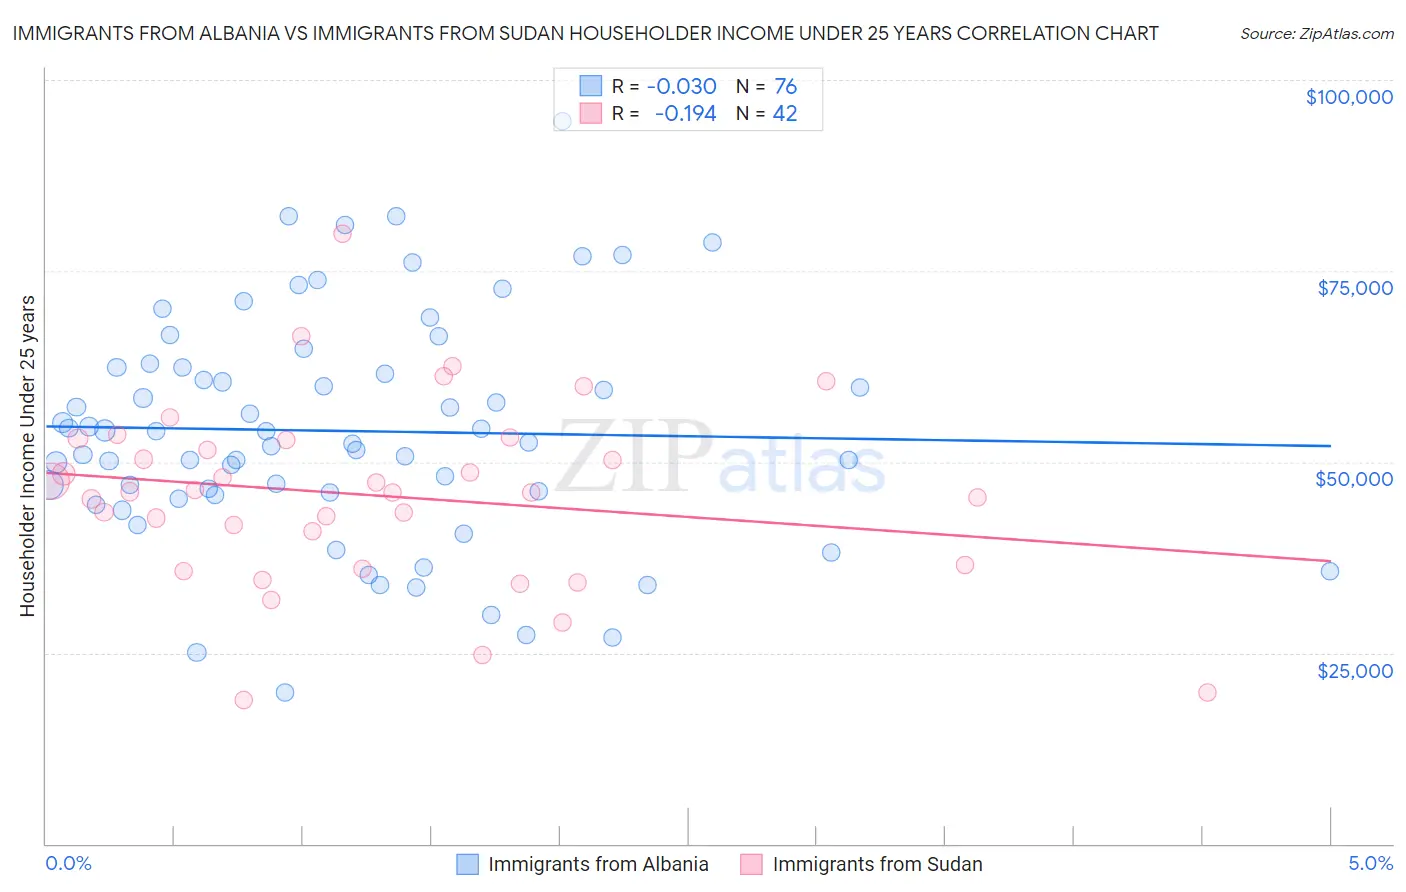
Immigrants from Albania vs Immigrants from Sudan Householder Income Under 25 years Correlation Chart
The statistical analysis conducted on geographies consisting of 107,044,611 people shows no correlation between the proportion of Immigrants from Albania and household income with householder under the age of 25 in the United States with a correlation coefficient (R) of -0.030 and weighted average of $53,597. Similarly, the statistical analysis conducted on geographies consisting of 112,922,604 people shows a poor negative correlation between the proportion of Immigrants from Sudan and household income with householder under the age of 25 in the United States with a correlation coefficient (R) of -0.194 and weighted average of $46,791, a difference of 14.5%.
Householder Income Under 25 years Correlation Summary
| Measurement | Immigrants from Albania | Immigrants from Sudan |
| Minimum | $19,811 | $18,750 |
| Maximum | $94,545 | $79,888 |
| Range | $74,734 | $61,138 |
| Mean | $54,041 | $45,607 |
| Median | $53,274 | $46,081 |
| Interquartile 25% (IQ1) | $45,869 | $36,434 |
| Interquartile 75% (IQ3) | $62,406 | $52,896 |
| Interquartile Range (IQR) | $16,537 | $16,462 |
| Standard Deviation (Sample) | $14,993 | $12,123 |
| Standard Deviation (Population) | $14,894 | $11,978 |
Similar Demographics by Householder Income Under 25 years
Demographics Similar to Immigrants from Albania by Householder Income Under 25 years
In terms of householder income under 25 years, the demographic groups most similar to Immigrants from Albania are Immigrants from Sweden ($53,621, a difference of 0.040%), Romanian ($53,632, a difference of 0.070%), Immigrants from Spain ($53,560, a difference of 0.070%), Lithuanian ($53,552, a difference of 0.080%), and Immigrants from Switzerland ($53,528, a difference of 0.13%).
| Demographics | Rating | Rank | Householder Income Under 25 years |
| Maltese | 97.8 /100 | #108 | Exceptional $53,735 |
| Immigrants | Ecuador | 97.7 /100 | #109 | Exceptional $53,722 |
| Greeks | 97.7 /100 | #110 | Exceptional $53,715 |
| Immigrants | Colombia | 97.7 /100 | #111 | Exceptional $53,714 |
| Immigrants | Oceania | 97.5 /100 | #112 | Exceptional $53,680 |
| Romanians | 97.2 /100 | #113 | Exceptional $53,632 |
| Immigrants | Sweden | 97.1 /100 | #114 | Exceptional $53,621 |
| Immigrants | Albania | 96.9 /100 | #115 | Exceptional $53,597 |
| Immigrants | Spain | 96.6 /100 | #116 | Exceptional $53,560 |
| Lithuanians | 96.6 /100 | #117 | Exceptional $53,552 |
| Immigrants | Switzerland | 96.3 /100 | #118 | Exceptional $53,528 |
| Italians | 95.4 /100 | #119 | Exceptional $53,426 |
| Guamanians/Chamorros | 95.3 /100 | #120 | Exceptional $53,423 |
| Immigrants | Canada | 95.2 /100 | #121 | Exceptional $53,411 |
| Immigrants | Ethiopia | 95.2 /100 | #122 | Exceptional $53,408 |
Demographics Similar to Immigrants from Sudan by Householder Income Under 25 years
In terms of householder income under 25 years, the demographic groups most similar to Immigrants from Sudan are African ($46,838, a difference of 0.10%), Spanish American ($46,913, a difference of 0.26%), Hopi ($46,978, a difference of 0.40%), Sudanese ($46,982, a difference of 0.41%), and Crow ($47,012, a difference of 0.47%).
| Demographics | Rating | Rank | Householder Income Under 25 years |
| Delaware | 0.0 /100 | #313 | Tragic $47,159 |
| Chippewa | 0.0 /100 | #314 | Tragic $47,015 |
| Crow | 0.0 /100 | #315 | Tragic $47,012 |
| Sudanese | 0.0 /100 | #316 | Tragic $46,982 |
| Hopi | 0.0 /100 | #317 | Tragic $46,978 |
| Spanish Americans | 0.0 /100 | #318 | Tragic $46,913 |
| Africans | 0.0 /100 | #319 | Tragic $46,838 |
| Immigrants | Sudan | 0.0 /100 | #320 | Tragic $46,791 |
| Potawatomi | 0.0 /100 | #321 | Tragic $46,462 |
| Sioux | 0.0 /100 | #322 | Tragic $46,417 |
| Immigrants | Saudi Arabia | 0.0 /100 | #323 | Tragic $46,187 |
| Dutch West Indians | 0.0 /100 | #324 | Tragic $45,816 |
| Immigrants | Bahamas | 0.0 /100 | #325 | Tragic $45,793 |
| Osage | 0.0 /100 | #326 | Tragic $45,764 |
| Bahamians | 0.0 /100 | #327 | Tragic $45,743 |