Immigrants from Albania vs Immigrants from Congo Householder Income Under 25 years
COMPARE
Immigrants from Albania
Immigrants from Congo
Householder Income Under 25 years
Householder Income Under 25 years Comparison
Immigrants from Albania
Immigrants from Congo
$53,597
HOUSEHOLDER INCOME UNDER 25 YEARS
96.9/ 100
METRIC RATING
115th/ 347
METRIC RANK
$43,266
HOUSEHOLDER INCOME UNDER 25 YEARS
0.0/ 100
METRIC RATING
344th/ 347
METRIC RANK
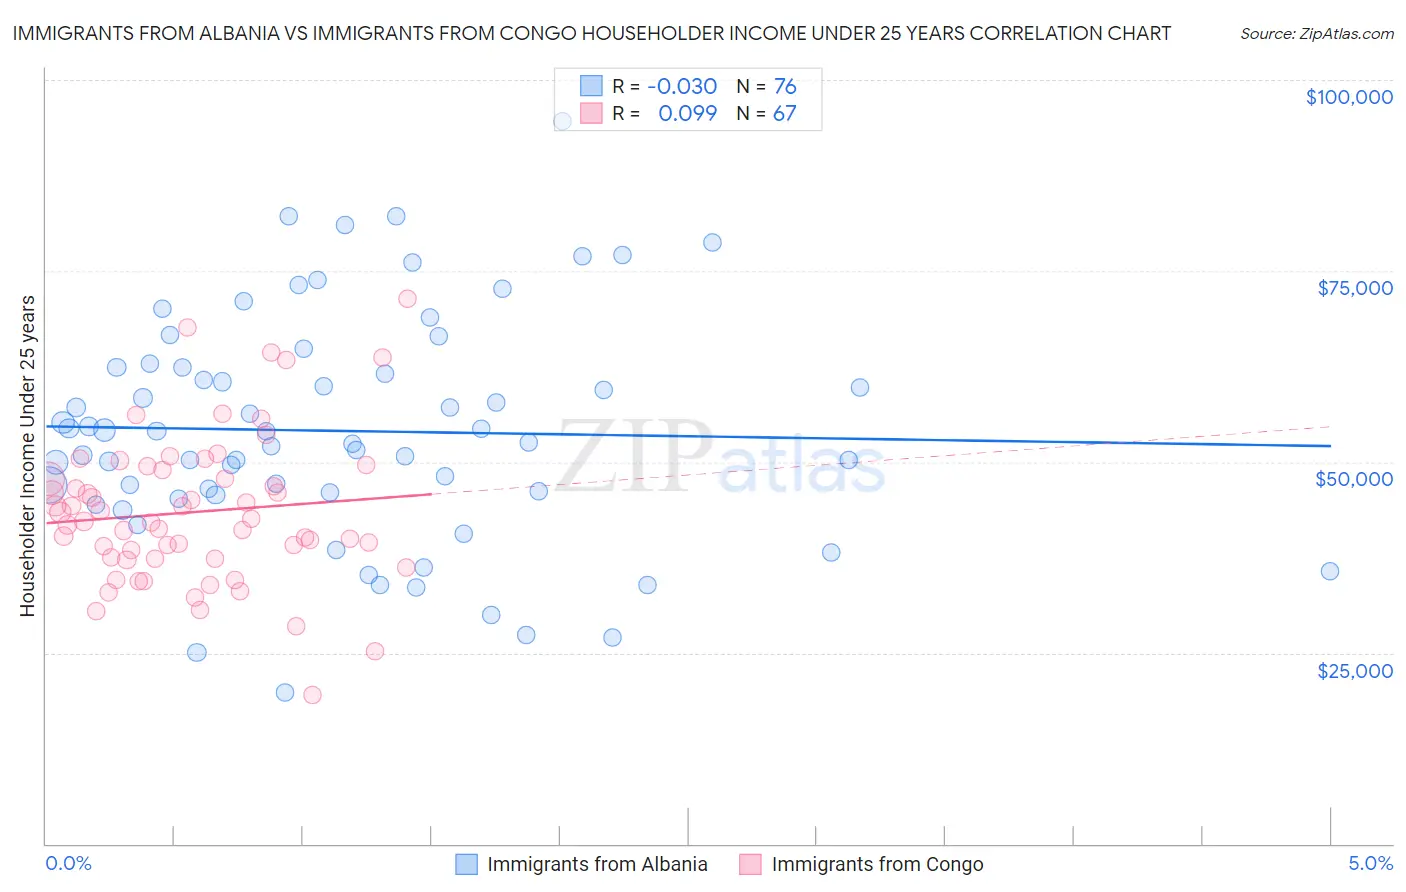
Immigrants from Albania vs Immigrants from Congo Householder Income Under 25 years Correlation Chart
The statistical analysis conducted on geographies consisting of 107,044,611 people shows no correlation between the proportion of Immigrants from Albania and household income with householder under the age of 25 in the United States with a correlation coefficient (R) of -0.030 and weighted average of $53,597. Similarly, the statistical analysis conducted on geographies consisting of 88,830,669 people shows a slight positive correlation between the proportion of Immigrants from Congo and household income with householder under the age of 25 in the United States with a correlation coefficient (R) of 0.099 and weighted average of $43,266, a difference of 23.9%.
Householder Income Under 25 years Correlation Summary
| Measurement | Immigrants from Albania | Immigrants from Congo |
| Minimum | $19,811 | $19,500 |
| Maximum | $94,545 | $71,336 |
| Range | $74,734 | $51,836 |
| Mean | $54,041 | $43,427 |
| Median | $53,274 | $42,211 |
| Interquartile 25% (IQ1) | $45,869 | $37,374 |
| Interquartile 75% (IQ3) | $62,406 | $48,976 |
| Interquartile Range (IQR) | $16,537 | $11,602 |
| Standard Deviation (Sample) | $14,993 | $9,717 |
| Standard Deviation (Population) | $14,894 | $9,644 |
Similar Demographics by Householder Income Under 25 years
Demographics Similar to Immigrants from Albania by Householder Income Under 25 years
In terms of householder income under 25 years, the demographic groups most similar to Immigrants from Albania are Immigrants from Sweden ($53,621, a difference of 0.040%), Romanian ($53,632, a difference of 0.070%), Immigrants from Spain ($53,560, a difference of 0.070%), Lithuanian ($53,552, a difference of 0.080%), and Immigrants from Switzerland ($53,528, a difference of 0.13%).
| Demographics | Rating | Rank | Householder Income Under 25 years |
| Maltese | 97.8 /100 | #108 | Exceptional $53,735 |
| Immigrants | Ecuador | 97.7 /100 | #109 | Exceptional $53,722 |
| Greeks | 97.7 /100 | #110 | Exceptional $53,715 |
| Immigrants | Colombia | 97.7 /100 | #111 | Exceptional $53,714 |
| Immigrants | Oceania | 97.5 /100 | #112 | Exceptional $53,680 |
| Romanians | 97.2 /100 | #113 | Exceptional $53,632 |
| Immigrants | Sweden | 97.1 /100 | #114 | Exceptional $53,621 |
| Immigrants | Albania | 96.9 /100 | #115 | Exceptional $53,597 |
| Immigrants | Spain | 96.6 /100 | #116 | Exceptional $53,560 |
| Lithuanians | 96.6 /100 | #117 | Exceptional $53,552 |
| Immigrants | Switzerland | 96.3 /100 | #118 | Exceptional $53,528 |
| Italians | 95.4 /100 | #119 | Exceptional $53,426 |
| Guamanians/Chamorros | 95.3 /100 | #120 | Exceptional $53,423 |
| Immigrants | Canada | 95.2 /100 | #121 | Exceptional $53,411 |
| Immigrants | Ethiopia | 95.2 /100 | #122 | Exceptional $53,408 |
Demographics Similar to Immigrants from Congo by Householder Income Under 25 years
In terms of householder income under 25 years, the demographic groups most similar to Immigrants from Congo are Immigrants from Yemen ($43,591, a difference of 0.75%), Arapaho ($44,003, a difference of 1.7%), Navajo ($42,380, a difference of 2.1%), Houma ($44,356, a difference of 2.5%), and Black/African American ($44,381, a difference of 2.6%).
| Demographics | Rating | Rank | Householder Income Under 25 years |
| Creek | 0.0 /100 | #333 | Tragic $45,371 |
| Cajuns | 0.0 /100 | #334 | Tragic $45,338 |
| Cheyenne | 0.0 /100 | #335 | Tragic $45,275 |
| Tohono O'odham | 0.0 /100 | #336 | Tragic $45,248 |
| Pueblo | 0.0 /100 | #337 | Tragic $45,018 |
| Chickasaw | 0.0 /100 | #338 | Tragic $44,763 |
| Kiowa | 0.0 /100 | #339 | Tragic $44,733 |
| Blacks/African Americans | 0.0 /100 | #340 | Tragic $44,381 |
| Houma | 0.0 /100 | #341 | Tragic $44,356 |
| Arapaho | 0.0 /100 | #342 | Tragic $44,003 |
| Immigrants | Yemen | 0.0 /100 | #343 | Tragic $43,591 |
| Immigrants | Congo | 0.0 /100 | #344 | Tragic $43,266 |
| Navajo | 0.0 /100 | #345 | Tragic $42,380 |
| Puerto Ricans | 0.0 /100 | #346 | Tragic $39,726 |
| Lumbee | 0.0 /100 | #347 | Tragic $34,584 |