Immigrants from Albania vs Immigrants from Thailand Median Male Earnings
COMPARE
Immigrants from Albania
Immigrants from Thailand
Median Male Earnings
Median Male Earnings Comparison
Immigrants from Albania
Immigrants from Thailand
$57,179
MEDIAN MALE EARNINGS
93.3/ 100
METRIC RATING
121st/ 347
METRIC RANK
$52,908
MEDIAN MALE EARNINGS
17.5/ 100
METRIC RATING
200th/ 347
METRIC RANK
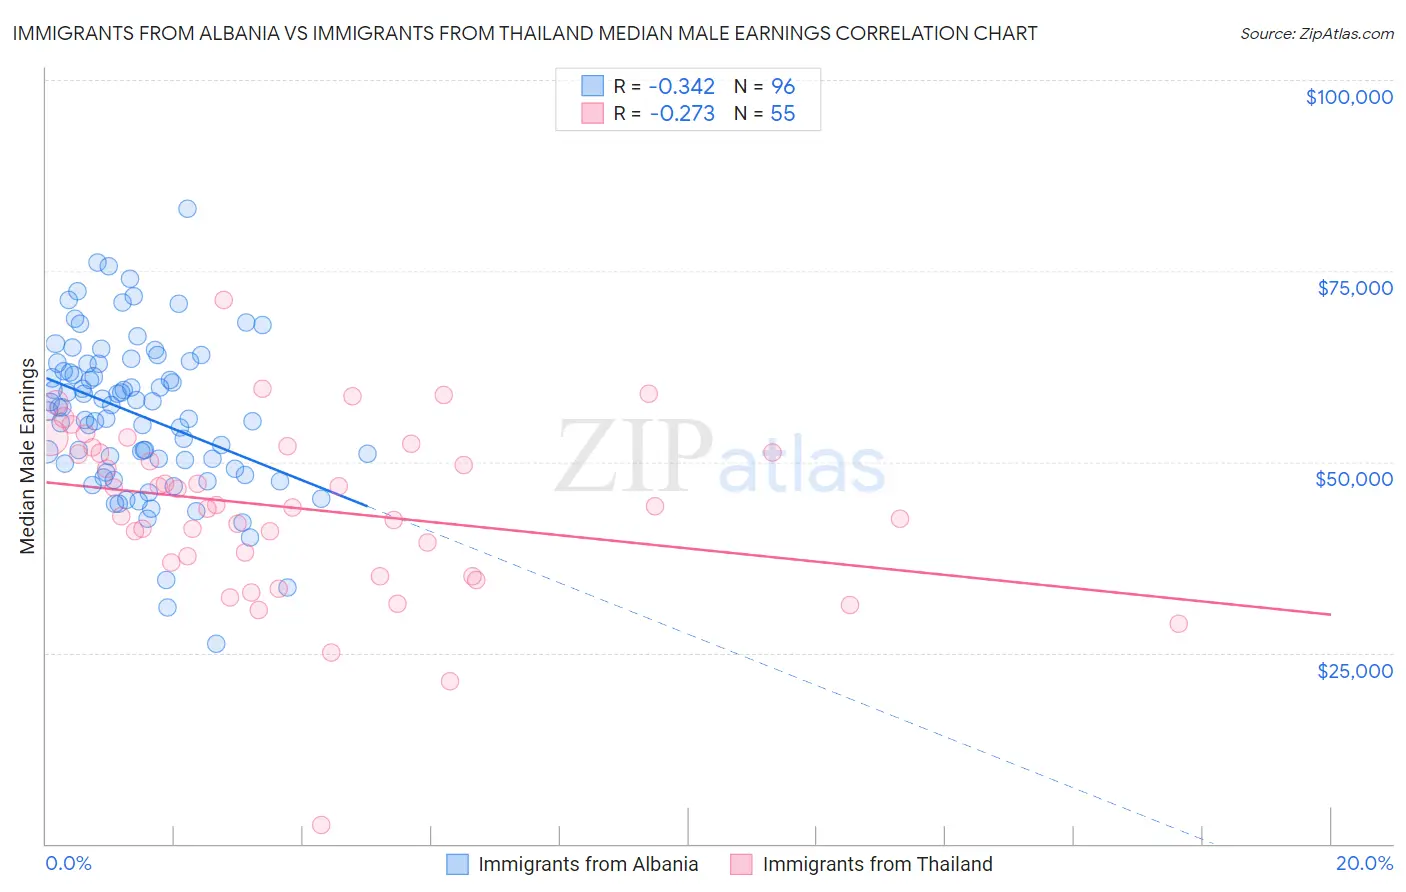
Immigrants from Albania vs Immigrants from Thailand Median Male Earnings Correlation Chart
The statistical analysis conducted on geographies consisting of 119,358,930 people shows a mild negative correlation between the proportion of Immigrants from Albania and median male earnings in the United States with a correlation coefficient (R) of -0.342 and weighted average of $57,179. Similarly, the statistical analysis conducted on geographies consisting of 316,970,143 people shows a weak negative correlation between the proportion of Immigrants from Thailand and median male earnings in the United States with a correlation coefficient (R) of -0.273 and weighted average of $52,908, a difference of 8.1%.
Median Male Earnings Correlation Summary
| Measurement | Immigrants from Albania | Immigrants from Thailand |
| Minimum | $26,127 | $2,499 |
| Maximum | $83,209 | $71,169 |
| Range | $57,082 | $68,670 |
| Mean | $56,160 | $43,857 |
| Median | $57,139 | $44,188 |
| Interquartile 25% (IQ1) | $49,475 | $36,813 |
| Interquartile 75% (IQ3) | $62,806 | $51,857 |
| Interquartile Range (IQR) | $13,331 | $15,045 |
| Standard Deviation (Sample) | $10,176 | $11,370 |
| Standard Deviation (Population) | $10,123 | $11,266 |
Similar Demographics by Median Male Earnings
Demographics Similar to Immigrants from Albania by Median Male Earnings
In terms of median male earnings, the demographic groups most similar to Immigrants from Albania are Immigrants from Jordan ($57,145, a difference of 0.060%), Slovene ($57,145, a difference of 0.060%), Canadian ($57,286, a difference of 0.19%), Arab ($57,298, a difference of 0.21%), and Hungarian ($57,309, a difference of 0.23%).
| Demographics | Rating | Rank | Median Male Earnings |
| Immigrants | Kuwait | 95.3 /100 | #114 | Exceptional $57,562 |
| Swedes | 94.8 /100 | #115 | Exceptional $57,445 |
| Lebanese | 94.6 /100 | #116 | Exceptional $57,409 |
| Immigrants | Zimbabwe | 94.3 /100 | #117 | Exceptional $57,352 |
| Hungarians | 94.0 /100 | #118 | Exceptional $57,309 |
| Arabs | 94.0 /100 | #119 | Exceptional $57,298 |
| Canadians | 93.9 /100 | #120 | Exceptional $57,286 |
| Immigrants | Albania | 93.3 /100 | #121 | Exceptional $57,179 |
| Immigrants | Jordan | 93.1 /100 | #122 | Exceptional $57,145 |
| Slovenes | 93.1 /100 | #123 | Exceptional $57,145 |
| Chileans | 91.9 /100 | #124 | Exceptional $56,973 |
| Immigrants | Morocco | 91.8 /100 | #125 | Exceptional $56,958 |
| Chinese | 91.1 /100 | #126 | Exceptional $56,872 |
| Brazilians | 90.9 /100 | #127 | Exceptional $56,837 |
| Immigrants | Syria | 90.8 /100 | #128 | Exceptional $56,830 |
Demographics Similar to Immigrants from Thailand by Median Male Earnings
In terms of median male earnings, the demographic groups most similar to Immigrants from Thailand are Immigrants from Bosnia and Herzegovina ($52,869, a difference of 0.070%), Immigrants from Uruguay ($52,860, a difference of 0.090%), Panamanian ($52,835, a difference of 0.14%), Ghanaian ($52,810, a difference of 0.19%), and Immigrants from Colombia ($52,725, a difference of 0.35%).
| Demographics | Rating | Rank | Median Male Earnings |
| Kenyans | 30.4 /100 | #193 | Fair $53,647 |
| Spanish | 29.0 /100 | #194 | Fair $53,576 |
| Immigrants | Azores | 27.5 /100 | #195 | Fair $53,503 |
| Immigrants | Africa | 26.6 /100 | #196 | Fair $53,457 |
| Immigrants | Kenya | 26.0 /100 | #197 | Fair $53,427 |
| Immigrants | Costa Rica | 22.6 /100 | #198 | Fair $53,237 |
| Tongans | 22.3 /100 | #199 | Fair $53,218 |
| Immigrants | Thailand | 17.5 /100 | #200 | Poor $52,908 |
| Immigrants | Bosnia and Herzegovina | 16.9 /100 | #201 | Poor $52,869 |
| Immigrants | Uruguay | 16.8 /100 | #202 | Poor $52,860 |
| Panamanians | 16.5 /100 | #203 | Poor $52,835 |
| Ghanaians | 16.1 /100 | #204 | Poor $52,810 |
| Immigrants | Colombia | 15.0 /100 | #205 | Poor $52,725 |
| Immigrants | Iraq | 14.5 /100 | #206 | Poor $52,681 |
| Vietnamese | 12.7 /100 | #207 | Poor $52,525 |