Immigrants from Panama vs Blackfeet Per Capita Income
COMPARE
Immigrants from Panama
Blackfeet
Per Capita Income
Per Capita Income Comparison
Immigrants from Panama
Blackfeet
$41,853
PER CAPITA INCOME
11.6/ 100
METRIC RATING
211th/ 347
METRIC RANK
$37,695
PER CAPITA INCOME
0.1/ 100
METRIC RATING
288th/ 347
METRIC RANK
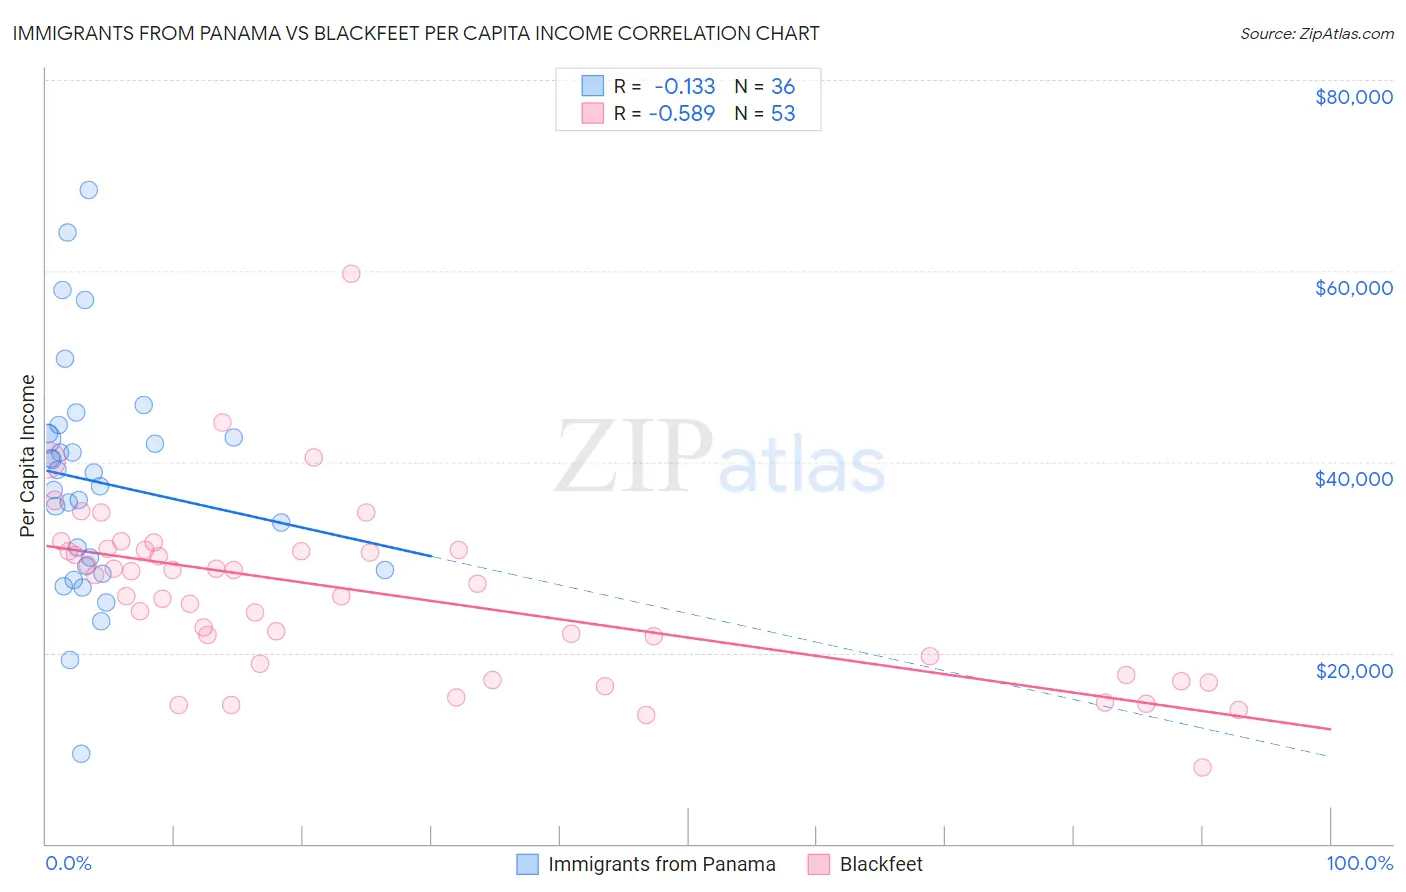
Immigrants from Panama vs Blackfeet Per Capita Income Correlation Chart
The statistical analysis conducted on geographies consisting of 221,187,071 people shows a poor negative correlation between the proportion of Immigrants from Panama and per capita income in the United States with a correlation coefficient (R) of -0.133 and weighted average of $41,853. Similarly, the statistical analysis conducted on geographies consisting of 309,586,612 people shows a substantial negative correlation between the proportion of Blackfeet and per capita income in the United States with a correlation coefficient (R) of -0.589 and weighted average of $37,695, a difference of 11.0%.
Per Capita Income Correlation Summary
| Measurement | Immigrants from Panama | Blackfeet |
| Minimum | $9,397 | $7,946 |
| Maximum | $68,465 | $59,700 |
| Range | $59,068 | $51,754 |
| Mean | $37,915 | $26,182 |
| Median | $38,159 | $27,256 |
| Interquartile 25% (IQ1) | $28,812 | $18,286 |
| Interquartile 75% (IQ3) | $42,786 | $30,810 |
| Interquartile Range (IQR) | $13,974 | $12,524 |
| Standard Deviation (Sample) | $12,078 | $9,146 |
| Standard Deviation (Population) | $11,909 | $9,059 |
Similar Demographics by Per Capita Income
Demographics Similar to Immigrants from Panama by Per Capita Income
In terms of per capita income, the demographic groups most similar to Immigrants from Panama are Immigrants from Senegal ($41,830, a difference of 0.050%), Ecuadorian ($41,958, a difference of 0.25%), Immigrants from Venezuela ($41,727, a difference of 0.30%), Immigrants from Sudan ($41,986, a difference of 0.32%), and Immigrants from Bangladesh ($41,709, a difference of 0.34%).
| Demographics | Rating | Rank | Per Capita Income |
| Aleuts | 16.4 /100 | #204 | Poor $42,210 |
| Whites/Caucasians | 15.9 /100 | #205 | Poor $42,180 |
| Ghanaians | 15.7 /100 | #206 | Poor $42,164 |
| Venezuelans | 14.4 /100 | #207 | Poor $42,074 |
| Panamanians | 13.9 /100 | #208 | Poor $42,035 |
| Immigrants | Sudan | 13.2 /100 | #209 | Poor $41,986 |
| Ecuadorians | 12.9 /100 | #210 | Poor $41,958 |
| Immigrants | Panama | 11.6 /100 | #211 | Poor $41,853 |
| Immigrants | Senegal | 11.3 /100 | #212 | Poor $41,830 |
| Immigrants | Venezuela | 10.2 /100 | #213 | Poor $41,727 |
| Immigrants | Bangladesh | 10.1 /100 | #214 | Poor $41,709 |
| Sudanese | 9.9 /100 | #215 | Tragic $41,695 |
| Tongans | 9.9 /100 | #216 | Tragic $41,693 |
| Guamanians/Chamorros | 9.7 /100 | #217 | Tragic $41,678 |
| Trinidadians and Tobagonians | 9.5 /100 | #218 | Tragic $41,655 |
Demographics Similar to Blackfeet by Per Capita Income
In terms of per capita income, the demographic groups most similar to Blackfeet are Dominican ($37,697, a difference of 0.0%), Central American Indian ($37,699, a difference of 0.010%), Guatemalan ($37,766, a difference of 0.19%), African ($37,785, a difference of 0.24%), and U.S. Virgin Islander ($37,589, a difference of 0.28%).
| Demographics | Rating | Rank | Per Capita Income |
| Immigrants | Dominica | 0.2 /100 | #281 | Tragic $37,952 |
| Immigrants | Laos | 0.1 /100 | #282 | Tragic $37,857 |
| Pennsylvania Germans | 0.1 /100 | #283 | Tragic $37,842 |
| Africans | 0.1 /100 | #284 | Tragic $37,785 |
| Guatemalans | 0.1 /100 | #285 | Tragic $37,766 |
| Central American Indians | 0.1 /100 | #286 | Tragic $37,699 |
| Dominicans | 0.1 /100 | #287 | Tragic $37,697 |
| Blackfeet | 0.1 /100 | #288 | Tragic $37,695 |
| U.S. Virgin Islanders | 0.1 /100 | #289 | Tragic $37,589 |
| Immigrants | Guatemala | 0.1 /100 | #290 | Tragic $37,550 |
| Cajuns | 0.1 /100 | #291 | Tragic $37,527 |
| Immigrants | Micronesia | 0.1 /100 | #292 | Tragic $37,464 |
| Mexican American Indians | 0.1 /100 | #293 | Tragic $37,407 |
| Cubans | 0.1 /100 | #294 | Tragic $37,383 |
| Immigrants | Dominican Republic | 0.1 /100 | #295 | Tragic $37,306 |