Immigrants from Afghanistan vs Aleut Per Capita Income
COMPARE
Immigrants from Afghanistan
Aleut
Per Capita Income
Per Capita Income Comparison
Immigrants from Afghanistan
Aleuts
$44,790
PER CAPITA INCOME
78.0/ 100
METRIC RATING
145th/ 347
METRIC RANK
$42,210
PER CAPITA INCOME
16.4/ 100
METRIC RATING
204th/ 347
METRIC RANK
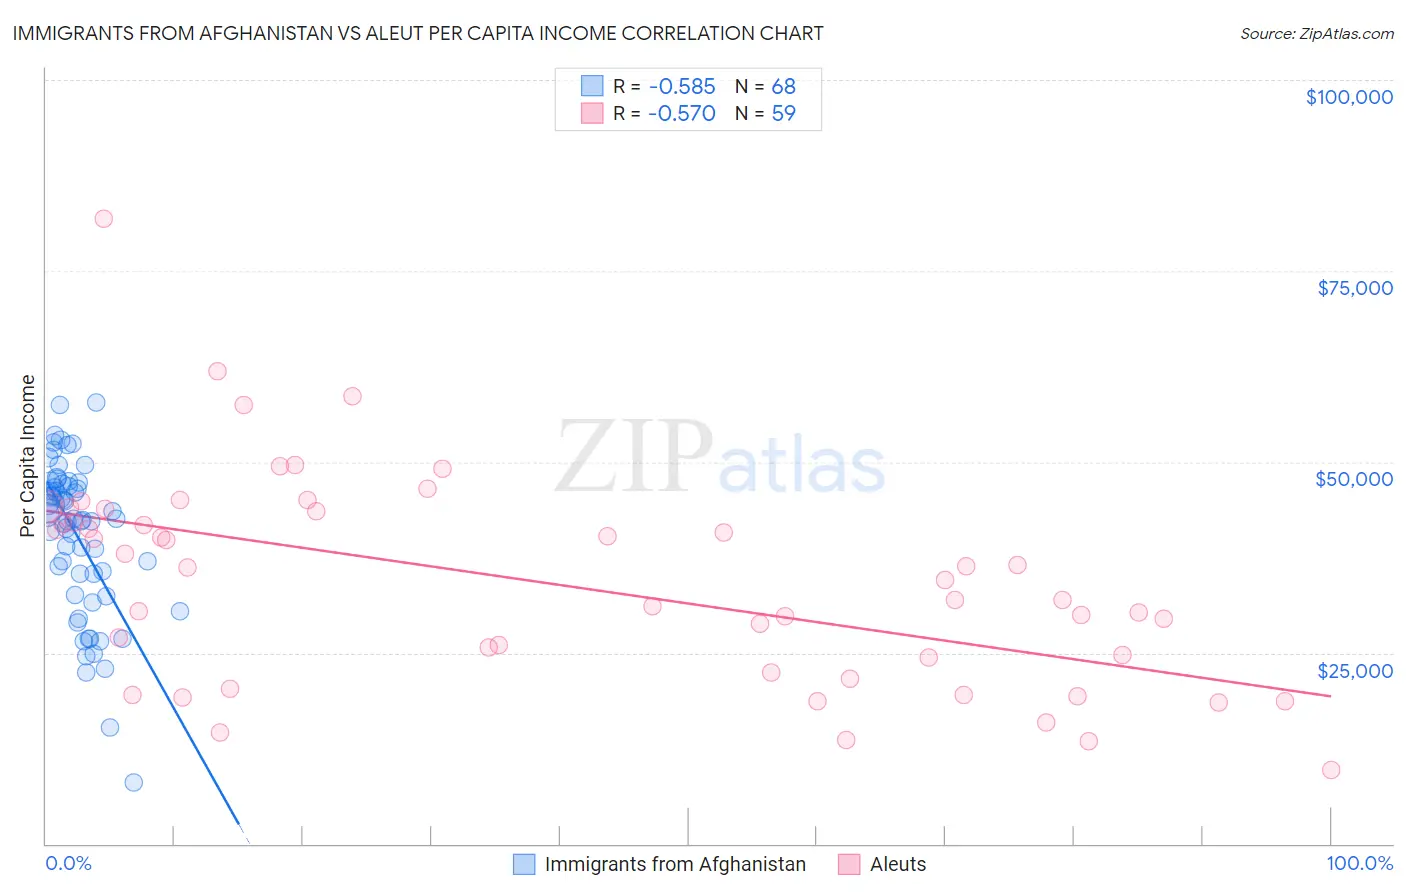
Immigrants from Afghanistan vs Aleut Per Capita Income Correlation Chart
The statistical analysis conducted on geographies consisting of 147,645,791 people shows a substantial negative correlation between the proportion of Immigrants from Afghanistan and per capita income in the United States with a correlation coefficient (R) of -0.585 and weighted average of $44,790. Similarly, the statistical analysis conducted on geographies consisting of 61,782,949 people shows a substantial negative correlation between the proportion of Aleuts and per capita income in the United States with a correlation coefficient (R) of -0.570 and weighted average of $42,210, a difference of 6.1%.
Per Capita Income Correlation Summary
| Measurement | Immigrants from Afghanistan | Aleut |
| Minimum | $8,026 | $9,575 |
| Maximum | $57,850 | $81,877 |
| Range | $49,824 | $72,302 |
| Mean | $40,206 | $34,258 |
| Median | $42,427 | $34,500 |
| Interquartile 25% (IQ1) | $33,957 | $22,490 |
| Interquartile 75% (IQ3) | $46,949 | $43,602 |
| Interquartile Range (IQR) | $12,992 | $21,112 |
| Standard Deviation (Sample) | $10,126 | $13,784 |
| Standard Deviation (Population) | $10,052 | $13,667 |
Similar Demographics by Per Capita Income
Demographics Similar to Immigrants from Afghanistan by Per Capita Income
In terms of per capita income, the demographic groups most similar to Immigrants from Afghanistan are Irish ($44,679, a difference of 0.25%), Icelander ($44,987, a difference of 0.44%), Czech ($44,595, a difference of 0.44%), Immigrants from Armenia ($44,552, a difference of 0.53%), and Immigrants from Uganda ($45,043, a difference of 0.56%).
| Demographics | Rating | Rank | Per Capita Income |
| Assyrians/Chaldeans/Syriacs | 84.8 /100 | #138 | Excellent $45,195 |
| Basques | 83.2 /100 | #139 | Excellent $45,086 |
| Immigrants | Jordan | 82.9 /100 | #140 | Excellent $45,066 |
| Slavs | 82.6 /100 | #141 | Excellent $45,049 |
| Ugandans | 82.6 /100 | #142 | Excellent $45,047 |
| Immigrants | Uganda | 82.5 /100 | #143 | Excellent $45,043 |
| Icelanders | 81.6 /100 | #144 | Excellent $44,987 |
| Immigrants | Afghanistan | 78.0 /100 | #145 | Good $44,790 |
| Irish | 75.8 /100 | #146 | Good $44,679 |
| Czechs | 74.1 /100 | #147 | Good $44,595 |
| Immigrants | Armenia | 73.1 /100 | #148 | Good $44,552 |
| Koreans | 72.5 /100 | #149 | Good $44,522 |
| Immigrants | Eritrea | 72.1 /100 | #150 | Good $44,509 |
| Norwegians | 71.5 /100 | #151 | Good $44,480 |
| Peruvians | 71.5 /100 | #152 | Good $44,479 |
Demographics Similar to Aleuts by Per Capita Income
In terms of per capita income, the demographic groups most similar to Aleuts are White/Caucasian ($42,180, a difference of 0.070%), Spanish ($42,249, a difference of 0.090%), Ghanaian ($42,164, a difference of 0.11%), Immigrants from Bosnia and Herzegovina ($42,278, a difference of 0.16%), and Immigrants from Thailand ($42,289, a difference of 0.19%).
| Demographics | Rating | Rank | Per Capita Income |
| Scotch-Irish | 22.6 /100 | #197 | Fair $42,563 |
| Immigrants | Portugal | 19.7 /100 | #198 | Poor $42,412 |
| Barbadians | 19.6 /100 | #199 | Poor $42,406 |
| Vietnamese | 19.0 /100 | #200 | Poor $42,368 |
| Immigrants | Thailand | 17.6 /100 | #201 | Poor $42,289 |
| Immigrants | Bosnia and Herzegovina | 17.5 /100 | #202 | Poor $42,278 |
| Spanish | 17.0 /100 | #203 | Poor $42,249 |
| Aleuts | 16.4 /100 | #204 | Poor $42,210 |
| Whites/Caucasians | 15.9 /100 | #205 | Poor $42,180 |
| Ghanaians | 15.7 /100 | #206 | Poor $42,164 |
| Venezuelans | 14.4 /100 | #207 | Poor $42,074 |
| Panamanians | 13.9 /100 | #208 | Poor $42,035 |
| Immigrants | Sudan | 13.2 /100 | #209 | Poor $41,986 |
| Ecuadorians | 12.9 /100 | #210 | Poor $41,958 |
| Immigrants | Panama | 11.6 /100 | #211 | Poor $41,853 |