Immigrants from Afghanistan vs Ethiopian Per Capita Income
COMPARE
Immigrants from Afghanistan
Ethiopian
Per Capita Income
Per Capita Income Comparison
Immigrants from Afghanistan
Ethiopians
$44,790
PER CAPITA INCOME
78.0/ 100
METRIC RATING
145th/ 347
METRIC RANK
$46,569
PER CAPITA INCOME
96.3/ 100
METRIC RATING
106th/ 347
METRIC RANK
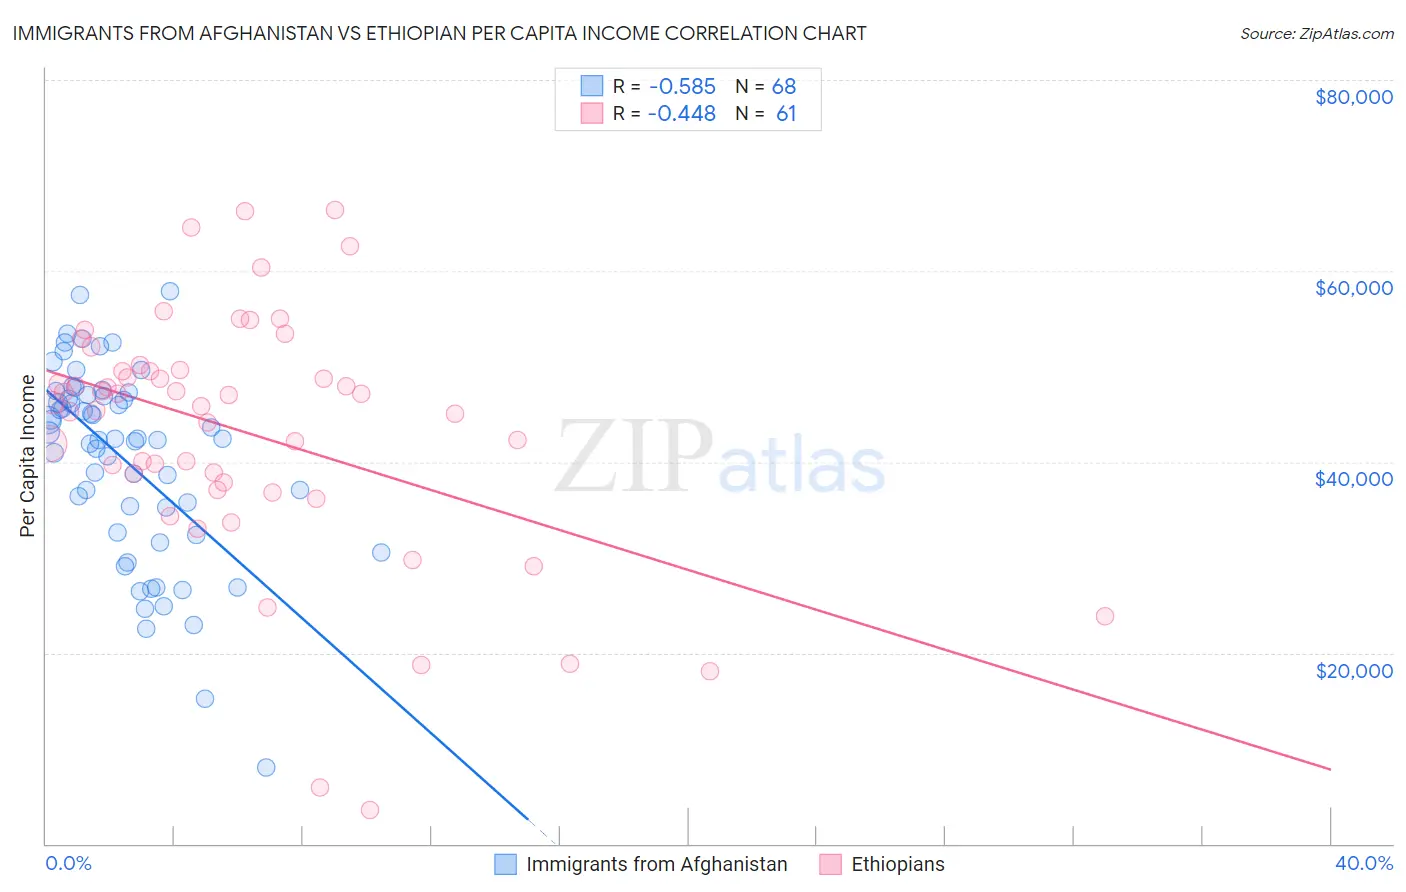
Immigrants from Afghanistan vs Ethiopian Per Capita Income Correlation Chart
The statistical analysis conducted on geographies consisting of 147,645,791 people shows a substantial negative correlation between the proportion of Immigrants from Afghanistan and per capita income in the United States with a correlation coefficient (R) of -0.585 and weighted average of $44,790. Similarly, the statistical analysis conducted on geographies consisting of 223,280,317 people shows a moderate negative correlation between the proportion of Ethiopians and per capita income in the United States with a correlation coefficient (R) of -0.448 and weighted average of $46,569, a difference of 4.0%.
Per Capita Income Correlation Summary
| Measurement | Immigrants from Afghanistan | Ethiopian |
| Minimum | $8,026 | $3,511 |
| Maximum | $57,850 | $66,352 |
| Range | $49,824 | $62,841 |
| Mean | $40,206 | $43,114 |
| Median | $42,427 | $46,234 |
| Interquartile 25% (IQ1) | $33,957 | $37,442 |
| Interquartile 75% (IQ3) | $46,949 | $49,561 |
| Interquartile Range (IQR) | $12,992 | $12,119 |
| Standard Deviation (Sample) | $10,126 | $12,938 |
| Standard Deviation (Population) | $10,052 | $12,832 |
Similar Demographics by Per Capita Income
Demographics Similar to Immigrants from Afghanistan by Per Capita Income
In terms of per capita income, the demographic groups most similar to Immigrants from Afghanistan are Irish ($44,679, a difference of 0.25%), Icelander ($44,987, a difference of 0.44%), Czech ($44,595, a difference of 0.44%), Immigrants from Armenia ($44,552, a difference of 0.53%), and Immigrants from Uganda ($45,043, a difference of 0.56%).
| Demographics | Rating | Rank | Per Capita Income |
| Assyrians/Chaldeans/Syriacs | 84.8 /100 | #138 | Excellent $45,195 |
| Basques | 83.2 /100 | #139 | Excellent $45,086 |
| Immigrants | Jordan | 82.9 /100 | #140 | Excellent $45,066 |
| Slavs | 82.6 /100 | #141 | Excellent $45,049 |
| Ugandans | 82.6 /100 | #142 | Excellent $45,047 |
| Immigrants | Uganda | 82.5 /100 | #143 | Excellent $45,043 |
| Icelanders | 81.6 /100 | #144 | Excellent $44,987 |
| Immigrants | Afghanistan | 78.0 /100 | #145 | Good $44,790 |
| Irish | 75.8 /100 | #146 | Good $44,679 |
| Czechs | 74.1 /100 | #147 | Good $44,595 |
| Immigrants | Armenia | 73.1 /100 | #148 | Good $44,552 |
| Koreans | 72.5 /100 | #149 | Good $44,522 |
| Immigrants | Eritrea | 72.1 /100 | #150 | Good $44,509 |
| Norwegians | 71.5 /100 | #151 | Good $44,480 |
| Peruvians | 71.5 /100 | #152 | Good $44,479 |
Demographics Similar to Ethiopians by Per Capita Income
In terms of per capita income, the demographic groups most similar to Ethiopians are British ($46,571, a difference of 0.0%), Serbian ($46,551, a difference of 0.040%), Immigrants from Kuwait ($46,543, a difference of 0.060%), Immigrants from Northern Africa ($46,531, a difference of 0.080%), and Chilean ($46,459, a difference of 0.24%).
| Demographics | Rating | Rank | Per Capita Income |
| Laotians | 97.8 /100 | #99 | Exceptional $47,041 |
| Immigrants | Lebanon | 97.5 /100 | #100 | Exceptional $46,938 |
| Immigrants | Uzbekistan | 97.5 /100 | #101 | Exceptional $46,929 |
| Immigrants | Western Asia | 97.4 /100 | #102 | Exceptional $46,876 |
| Syrians | 97.2 /100 | #103 | Exceptional $46,837 |
| Brazilians | 96.8 /100 | #104 | Exceptional $46,700 |
| British | 96.3 /100 | #105 | Exceptional $46,571 |
| Ethiopians | 96.3 /100 | #106 | Exceptional $46,569 |
| Serbians | 96.2 /100 | #107 | Exceptional $46,551 |
| Immigrants | Kuwait | 96.2 /100 | #108 | Exceptional $46,543 |
| Immigrants | Northern Africa | 96.2 /100 | #109 | Exceptional $46,531 |
| Chileans | 95.9 /100 | #110 | Exceptional $46,459 |
| Taiwanese | 95.8 /100 | #111 | Exceptional $46,455 |
| Immigrants | Morocco | 95.7 /100 | #112 | Exceptional $46,430 |
| Immigrants | Albania | 95.5 /100 | #113 | Exceptional $46,387 |