Icelander vs Immigrants from Western Africa Householder Income Under 25 years
COMPARE
Icelander
Immigrants from Western Africa
Householder Income Under 25 years
Householder Income Under 25 years Comparison
Icelanders
Immigrants from Western Africa
$51,247
HOUSEHOLDER INCOME UNDER 25 YEARS
9.1/ 100
METRIC RATING
215th/ 347
METRIC RANK
$49,621
HOUSEHOLDER INCOME UNDER 25 YEARS
0.2/ 100
METRIC RATING
277th/ 347
METRIC RANK
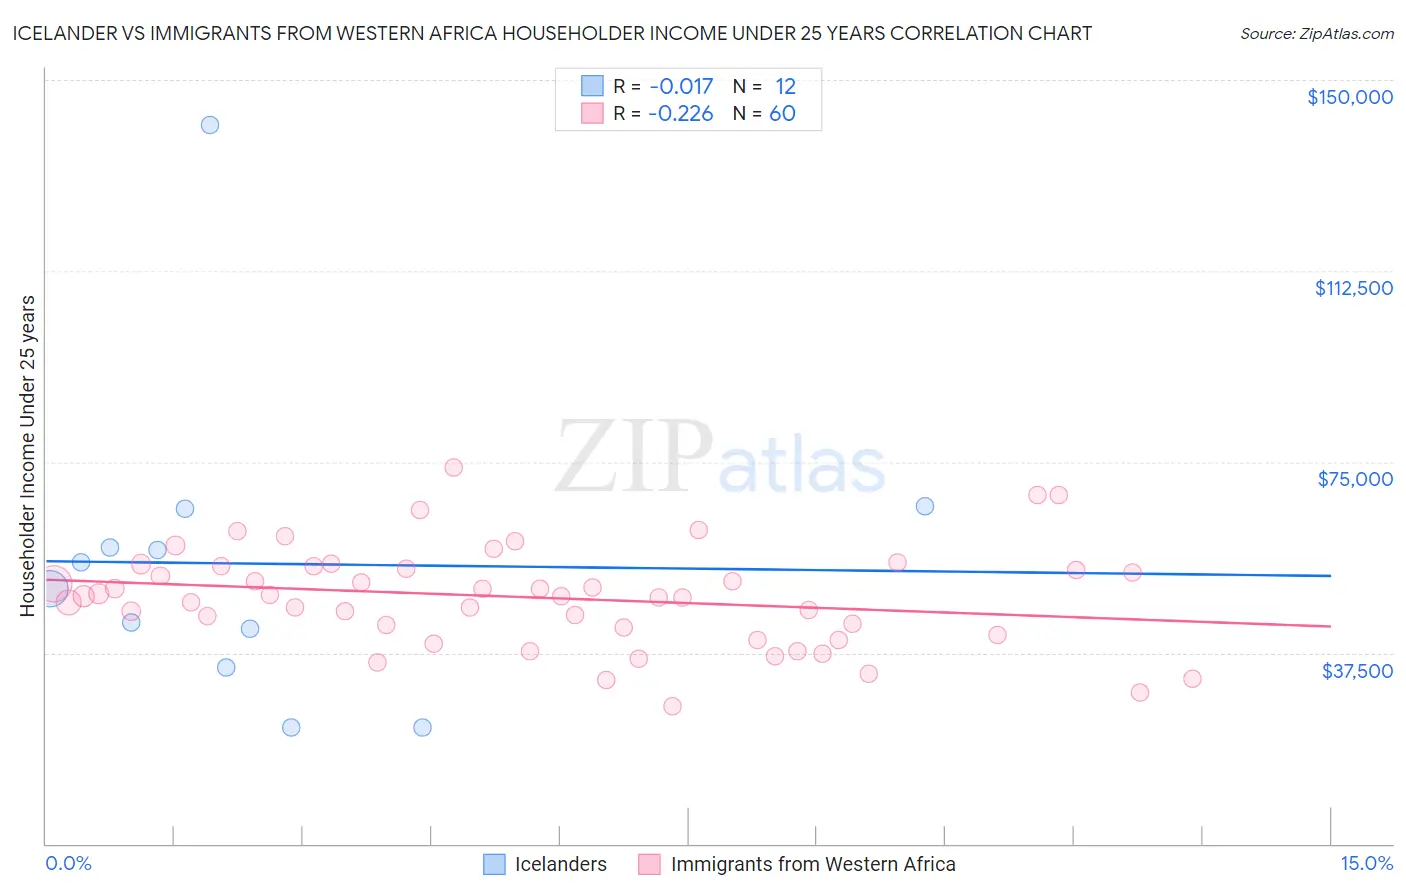
Icelander vs Immigrants from Western Africa Householder Income Under 25 years Correlation Chart
The statistical analysis conducted on geographies consisting of 147,067,762 people shows no correlation between the proportion of Icelanders and household income with householder under the age of 25 in the United States with a correlation coefficient (R) of -0.017 and weighted average of $51,247. Similarly, the statistical analysis conducted on geographies consisting of 309,472,028 people shows a weak negative correlation between the proportion of Immigrants from Western Africa and household income with householder under the age of 25 in the United States with a correlation coefficient (R) of -0.226 and weighted average of $49,621, a difference of 3.3%.
Householder Income Under 25 years Correlation Summary
| Measurement | Icelander | Immigrants from Western Africa |
| Minimum | $22,794 | $26,996 |
| Maximum | $141,236 | $74,007 |
| Range | $118,442 | $47,011 |
| Mean | $55,024 | $48,371 |
| Median | $52,703 | $48,580 |
| Interquartile 25% (IQ1) | $38,302 | $41,721 |
| Interquartile 75% (IQ3) | $62,047 | $54,243 |
| Interquartile Range (IQR) | $23,745 | $12,522 |
| Standard Deviation (Sample) | $30,921 | $9,808 |
| Standard Deviation (Population) | $29,605 | $9,726 |
Similar Demographics by Householder Income Under 25 years
Demographics Similar to Icelanders by Householder Income Under 25 years
In terms of householder income under 25 years, the demographic groups most similar to Icelanders are Zimbabwean ($51,259, a difference of 0.020%), Dutch ($51,265, a difference of 0.030%), French ($51,230, a difference of 0.030%), Czechoslovakian ($51,224, a difference of 0.050%), and Immigrants from Belize ($51,223, a difference of 0.050%).
| Demographics | Rating | Rank | Householder Income Under 25 years |
| Immigrants | Jordan | 11.9 /100 | #208 | Poor $51,370 |
| Syrians | 11.4 /100 | #209 | Poor $51,353 |
| Immigrants | Ghana | 10.9 /100 | #210 | Poor $51,333 |
| Irish | 10.6 /100 | #211 | Poor $51,317 |
| Immigrants | Panama | 9.7 /100 | #212 | Tragic $51,278 |
| Dutch | 9.4 /100 | #213 | Tragic $51,265 |
| Zimbabweans | 9.3 /100 | #214 | Tragic $51,259 |
| Icelanders | 9.1 /100 | #215 | Tragic $51,247 |
| French | 8.7 /100 | #216 | Tragic $51,230 |
| Czechoslovakians | 8.6 /100 | #217 | Tragic $51,224 |
| Immigrants | Belize | 8.6 /100 | #218 | Tragic $51,223 |
| Arabs | 8.5 /100 | #219 | Tragic $51,219 |
| Immigrants | Germany | 8.0 /100 | #220 | Tragic $51,190 |
| Immigrants | Eastern Africa | 7.4 /100 | #221 | Tragic $51,158 |
| Spaniards | 6.8 /100 | #222 | Tragic $51,117 |
Demographics Similar to Immigrants from Western Africa by Householder Income Under 25 years
In terms of householder income under 25 years, the demographic groups most similar to Immigrants from Western Africa are Dominican ($49,633, a difference of 0.020%), Immigrants from Kenya ($49,633, a difference of 0.030%), Immigrants from Senegal ($49,742, a difference of 0.24%), Slovak ($49,753, a difference of 0.27%), and Colville ($49,774, a difference of 0.31%).
| Demographics | Rating | Rank | Householder Income Under 25 years |
| Mexicans | 0.5 /100 | #270 | Tragic $49,989 |
| Taiwanese | 0.3 /100 | #271 | Tragic $49,804 |
| Colville | 0.3 /100 | #272 | Tragic $49,774 |
| Slovaks | 0.3 /100 | #273 | Tragic $49,753 |
| Immigrants | Senegal | 0.3 /100 | #274 | Tragic $49,742 |
| Immigrants | Kenya | 0.2 /100 | #275 | Tragic $49,633 |
| Dominicans | 0.2 /100 | #276 | Tragic $49,633 |
| Immigrants | Western Africa | 0.2 /100 | #277 | Tragic $49,621 |
| Nigerians | 0.1 /100 | #278 | Tragic $49,416 |
| Apache | 0.1 /100 | #279 | Tragic $49,395 |
| Hmong | 0.1 /100 | #280 | Tragic $49,364 |
| Immigrants | Nonimmigrants | 0.1 /100 | #281 | Tragic $49,348 |
| Alsatians | 0.1 /100 | #282 | Tragic $49,267 |
| Immigrants | Nigeria | 0.1 /100 | #283 | Tragic $49,174 |
| Carpatho Rusyns | 0.1 /100 | #284 | Tragic $49,113 |