Icelander vs Cajun Householder Income Under 25 years
COMPARE
Icelander
Cajun
Householder Income Under 25 years
Householder Income Under 25 years Comparison
Icelanders
Cajuns
$51,247
HOUSEHOLDER INCOME UNDER 25 YEARS
9.1/ 100
METRIC RATING
215th/ 347
METRIC RANK
$45,338
HOUSEHOLDER INCOME UNDER 25 YEARS
0.0/ 100
METRIC RATING
334th/ 347
METRIC RANK
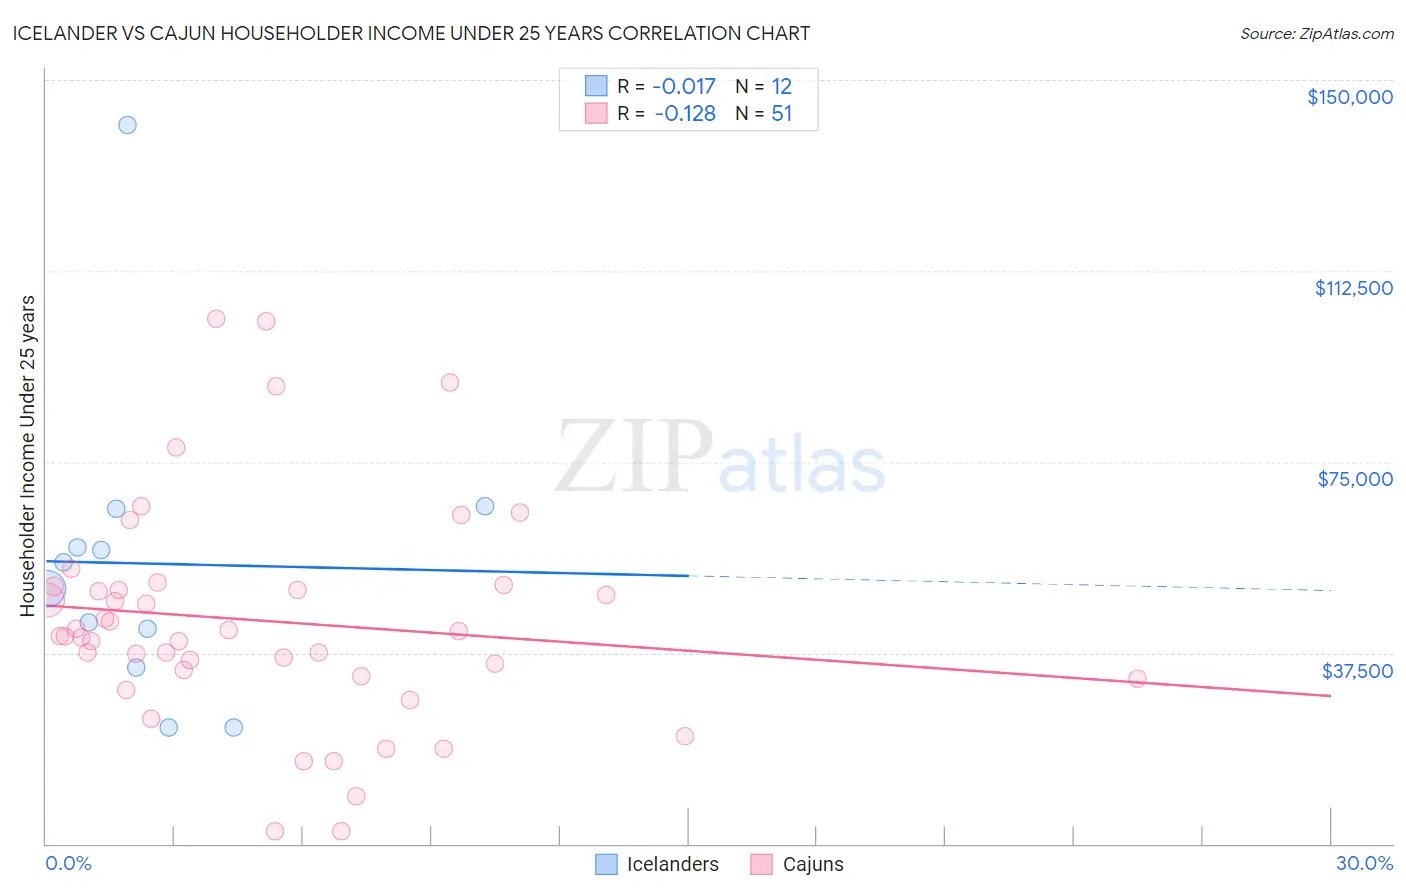
Icelander vs Cajun Householder Income Under 25 years Correlation Chart
The statistical analysis conducted on geographies consisting of 147,067,762 people shows no correlation between the proportion of Icelanders and household income with householder under the age of 25 in the United States with a correlation coefficient (R) of -0.017 and weighted average of $51,247. Similarly, the statistical analysis conducted on geographies consisting of 138,130,250 people shows a poor negative correlation between the proportion of Cajuns and household income with householder under the age of 25 in the United States with a correlation coefficient (R) of -0.128 and weighted average of $45,338, a difference of 13.0%.
Householder Income Under 25 years Correlation Summary
| Measurement | Icelander | Cajun |
| Minimum | $22,794 | $2,499 |
| Maximum | $141,236 | $103,125 |
| Range | $118,442 | $100,626 |
| Mean | $55,024 | $43,768 |
| Median | $52,703 | $40,772 |
| Interquartile 25% (IQ1) | $38,302 | $33,015 |
| Interquartile 75% (IQ3) | $62,047 | $50,628 |
| Interquartile Range (IQR) | $23,745 | $17,613 |
| Standard Deviation (Sample) | $30,921 | $21,959 |
| Standard Deviation (Population) | $29,605 | $21,742 |
Similar Demographics by Householder Income Under 25 years
Demographics Similar to Icelanders by Householder Income Under 25 years
In terms of householder income under 25 years, the demographic groups most similar to Icelanders are Zimbabwean ($51,259, a difference of 0.020%), Dutch ($51,265, a difference of 0.030%), French ($51,230, a difference of 0.030%), Czechoslovakian ($51,224, a difference of 0.050%), and Immigrants from Belize ($51,223, a difference of 0.050%).
| Demographics | Rating | Rank | Householder Income Under 25 years |
| Immigrants | Jordan | 11.9 /100 | #208 | Poor $51,370 |
| Syrians | 11.4 /100 | #209 | Poor $51,353 |
| Immigrants | Ghana | 10.9 /100 | #210 | Poor $51,333 |
| Irish | 10.6 /100 | #211 | Poor $51,317 |
| Immigrants | Panama | 9.7 /100 | #212 | Tragic $51,278 |
| Dutch | 9.4 /100 | #213 | Tragic $51,265 |
| Zimbabweans | 9.3 /100 | #214 | Tragic $51,259 |
| Icelanders | 9.1 /100 | #215 | Tragic $51,247 |
| French | 8.7 /100 | #216 | Tragic $51,230 |
| Czechoslovakians | 8.6 /100 | #217 | Tragic $51,224 |
| Immigrants | Belize | 8.6 /100 | #218 | Tragic $51,223 |
| Arabs | 8.5 /100 | #219 | Tragic $51,219 |
| Immigrants | Germany | 8.0 /100 | #220 | Tragic $51,190 |
| Immigrants | Eastern Africa | 7.4 /100 | #221 | Tragic $51,158 |
| Spaniards | 6.8 /100 | #222 | Tragic $51,117 |
Demographics Similar to Cajuns by Householder Income Under 25 years
In terms of householder income under 25 years, the demographic groups most similar to Cajuns are Creek ($45,371, a difference of 0.070%), Cheyenne ($45,275, a difference of 0.14%), Tohono O'odham ($45,248, a difference of 0.20%), Choctaw ($45,450, a difference of 0.25%), and Immigrants from Zaire ($45,529, a difference of 0.42%).
| Demographics | Rating | Rank | Householder Income Under 25 years |
| Bahamians | 0.0 /100 | #327 | Tragic $45,743 |
| German Russians | 0.0 /100 | #328 | Tragic $45,673 |
| Seminole | 0.0 /100 | #329 | Tragic $45,649 |
| Indonesians | 0.0 /100 | #330 | Tragic $45,566 |
| Immigrants | Zaire | 0.0 /100 | #331 | Tragic $45,529 |
| Choctaw | 0.0 /100 | #332 | Tragic $45,450 |
| Creek | 0.0 /100 | #333 | Tragic $45,371 |
| Cajuns | 0.0 /100 | #334 | Tragic $45,338 |
| Cheyenne | 0.0 /100 | #335 | Tragic $45,275 |
| Tohono O'odham | 0.0 /100 | #336 | Tragic $45,248 |
| Pueblo | 0.0 /100 | #337 | Tragic $45,018 |
| Chickasaw | 0.0 /100 | #338 | Tragic $44,763 |
| Kiowa | 0.0 /100 | #339 | Tragic $44,733 |
| Blacks/African Americans | 0.0 /100 | #340 | Tragic $44,381 |
| Houma | 0.0 /100 | #341 | Tragic $44,356 |