Hungarian vs Immigrants from Thailand Householder Income Under 25 years
COMPARE
Hungarian
Immigrants from Thailand
Householder Income Under 25 years
Householder Income Under 25 years Comparison
Hungarians
Immigrants from Thailand
$50,247
HOUSEHOLDER INCOME UNDER 25 YEARS
0.9/ 100
METRIC RATING
261st/ 347
METRIC RANK
$50,645
HOUSEHOLDER INCOME UNDER 25 YEARS
2.2/ 100
METRIC RATING
243rd/ 347
METRIC RANK
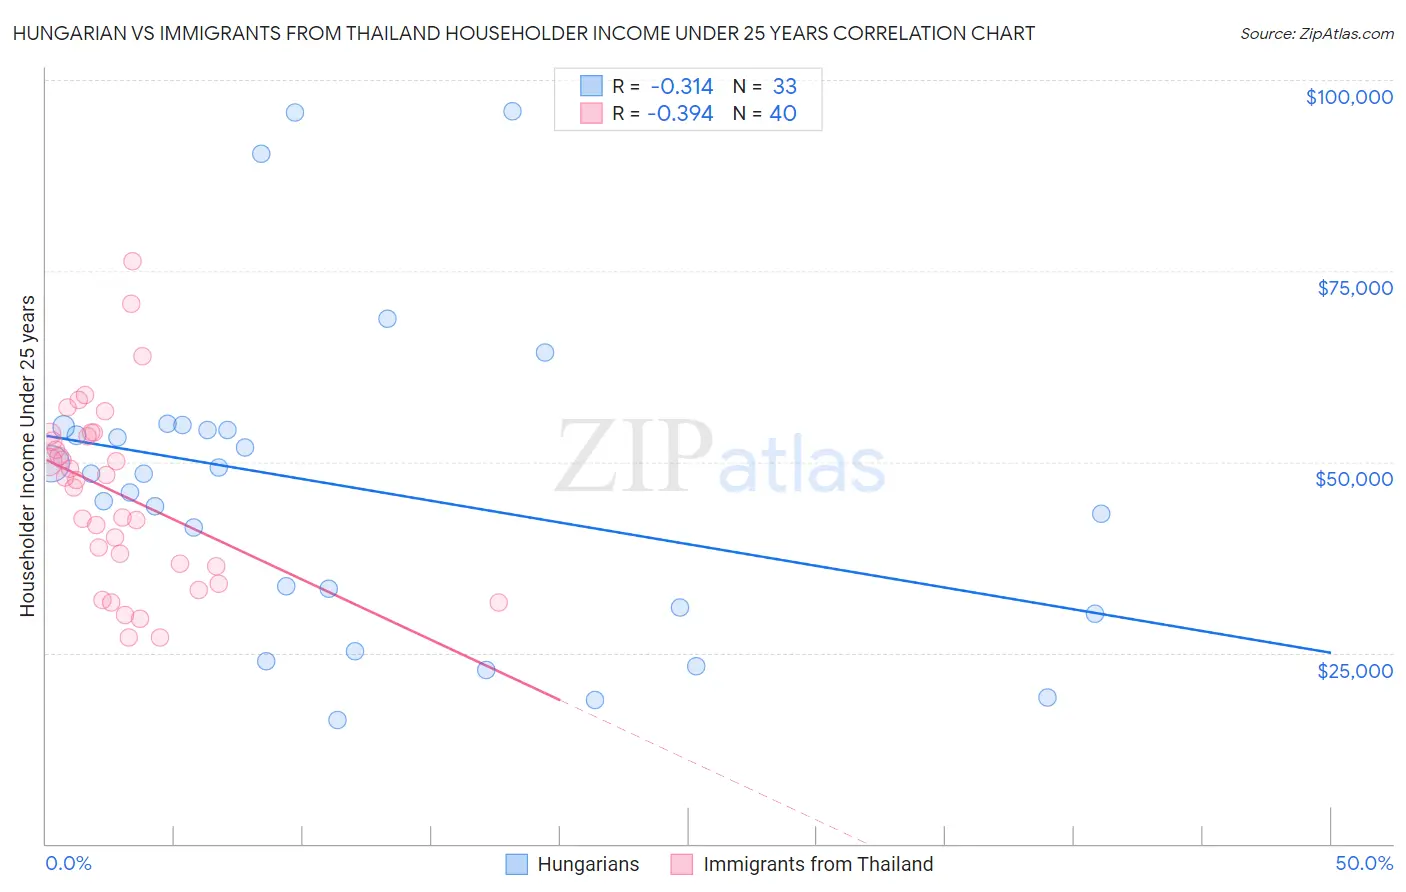
Hungarian vs Immigrants from Thailand Householder Income Under 25 years Correlation Chart
The statistical analysis conducted on geographies consisting of 392,087,148 people shows a mild negative correlation between the proportion of Hungarians and household income with householder under the age of 25 in the United States with a correlation coefficient (R) of -0.314 and weighted average of $50,247. Similarly, the statistical analysis conducted on geographies consisting of 278,847,431 people shows a mild negative correlation between the proportion of Immigrants from Thailand and household income with householder under the age of 25 in the United States with a correlation coefficient (R) of -0.394 and weighted average of $50,645, a difference of 0.79%.
Householder Income Under 25 years Correlation Summary
| Measurement | Hungarian | Immigrants from Thailand |
| Minimum | $16,220 | $27,000 |
| Maximum | $95,845 | $76,250 |
| Range | $79,625 | $49,250 |
| Mean | $46,639 | $45,889 |
| Median | $48,413 | $47,771 |
| Interquartile 25% (IQ1) | $30,495 | $36,516 |
| Interquartile 75% (IQ3) | $54,364 | $53,502 |
| Interquartile Range (IQR) | $23,869 | $16,986 |
| Standard Deviation (Sample) | $20,516 | $11,714 |
| Standard Deviation (Population) | $20,203 | $11,567 |
Demographics Similar to Hungarians and Immigrants from Thailand by Householder Income Under 25 years
In terms of householder income under 25 years, the demographic groups most similar to Hungarians are Haitian ($50,231, a difference of 0.030%), Hispanic or Latino ($50,279, a difference of 0.060%), Immigrants from Dominica ($50,301, a difference of 0.11%), White/Caucasian ($50,336, a difference of 0.18%), and Lebanese ($50,355, a difference of 0.21%). Similarly, the demographic groups most similar to Immigrants from Thailand are Cuban ($50,655, a difference of 0.020%), Marshallese ($50,627, a difference of 0.040%), Immigrants from Africa ($50,609, a difference of 0.070%), Welsh ($50,597, a difference of 0.10%), and Immigrants from Bosnia and Herzegovina ($50,565, a difference of 0.16%).
| Demographics | Rating | Rank | Householder Income Under 25 years |
| Cubans | 2.3 /100 | #242 | Tragic $50,655 |
| Immigrants | Thailand | 2.2 /100 | #243 | Tragic $50,645 |
| Marshallese | 2.1 /100 | #244 | Tragic $50,627 |
| Immigrants | Africa | 2.0 /100 | #245 | Tragic $50,609 |
| Welsh | 2.0 /100 | #246 | Tragic $50,597 |
| Immigrants | Bosnia and Herzegovina | 1.8 /100 | #247 | Tragic $50,565 |
| Slavs | 1.8 /100 | #248 | Tragic $50,563 |
| Scottish | 1.8 /100 | #249 | Tragic $50,554 |
| Immigrants | Cabo Verde | 1.7 /100 | #250 | Tragic $50,520 |
| Celtics | 1.4 /100 | #251 | Tragic $50,447 |
| Immigrants | Mexico | 1.3 /100 | #252 | Tragic $50,422 |
| Immigrants | Haiti | 1.2 /100 | #253 | Tragic $50,398 |
| Luxembourgers | 1.2 /100 | #254 | Tragic $50,379 |
| Aleuts | 1.2 /100 | #255 | Tragic $50,377 |
| Immigrants | Cuba | 1.2 /100 | #256 | Tragic $50,374 |
| Lebanese | 1.1 /100 | #257 | Tragic $50,355 |
| Whites/Caucasians | 1.1 /100 | #258 | Tragic $50,336 |
| Immigrants | Dominica | 1.0 /100 | #259 | Tragic $50,301 |
| Hispanics or Latinos | 0.9 /100 | #260 | Tragic $50,279 |
| Hungarians | 0.9 /100 | #261 | Tragic $50,247 |
| Haitians | 0.8 /100 | #262 | Tragic $50,231 |