South American Indian vs Immigrants from Thailand Householder Income Under 25 years
COMPARE
South American Indian
Immigrants from Thailand
Householder Income Under 25 years
Householder Income Under 25 years Comparison
South American Indians
Immigrants from Thailand
$52,979
HOUSEHOLDER INCOME UNDER 25 YEARS
87.3/ 100
METRIC RATING
144th/ 347
METRIC RANK
$50,645
HOUSEHOLDER INCOME UNDER 25 YEARS
2.2/ 100
METRIC RATING
243rd/ 347
METRIC RANK
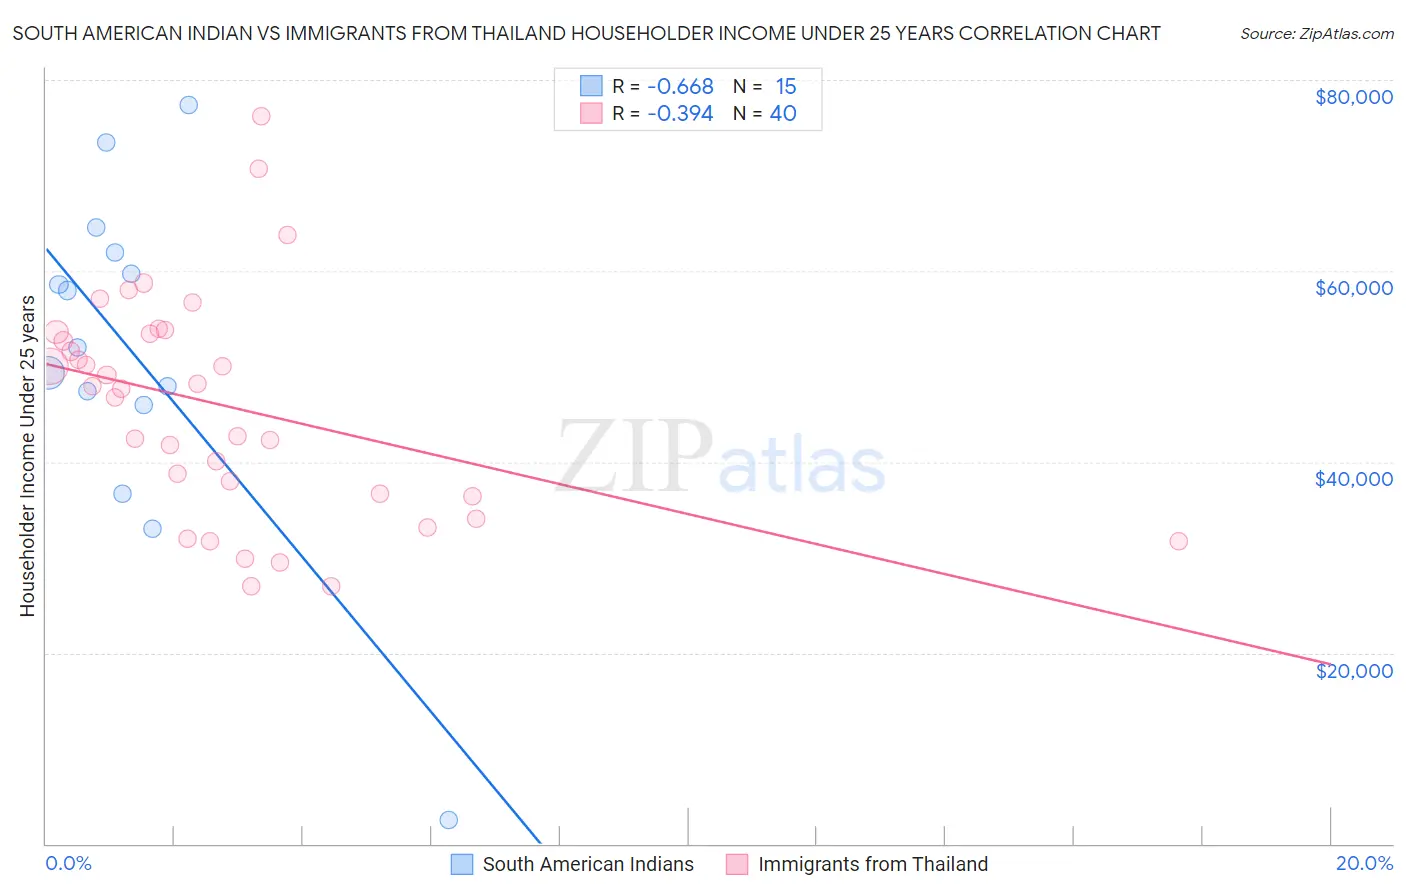
South American Indian vs Immigrants from Thailand Householder Income Under 25 years Correlation Chart
The statistical analysis conducted on geographies consisting of 149,724,736 people shows a significant negative correlation between the proportion of South American Indians and household income with householder under the age of 25 in the United States with a correlation coefficient (R) of -0.668 and weighted average of $52,979. Similarly, the statistical analysis conducted on geographies consisting of 278,847,431 people shows a mild negative correlation between the proportion of Immigrants from Thailand and household income with householder under the age of 25 in the United States with a correlation coefficient (R) of -0.394 and weighted average of $50,645, a difference of 4.6%.
Householder Income Under 25 years Correlation Summary
| Measurement | South American Indian | Immigrants from Thailand |
| Minimum | $2,499 | $27,000 |
| Maximum | $77,389 | $76,250 |
| Range | $74,890 | $49,250 |
| Mean | $51,232 | $45,889 |
| Median | $52,040 | $47,771 |
| Interquartile 25% (IQ1) | $45,962 | $36,516 |
| Interquartile 75% (IQ3) | $61,870 | $53,502 |
| Interquartile Range (IQR) | $15,908 | $16,986 |
| Standard Deviation (Sample) | $18,152 | $11,714 |
| Standard Deviation (Population) | $17,536 | $11,567 |
Similar Demographics by Householder Income Under 25 years
Demographics Similar to South American Indians by Householder Income Under 25 years
In terms of householder income under 25 years, the demographic groups most similar to South American Indians are Immigrants from Armenia ($52,986, a difference of 0.010%), Swedish ($52,986, a difference of 0.010%), Immigrants from Western Europe ($52,957, a difference of 0.040%), Danish ($53,041, a difference of 0.12%), and Hawaiian ($53,078, a difference of 0.19%).
| Demographics | Rating | Rank | Householder Income Under 25 years |
| Immigrants | Barbados | 91.5 /100 | #137 | Exceptional $53,163 |
| Norwegians | 90.8 /100 | #138 | Exceptional $53,127 |
| Costa Ricans | 90.4 /100 | #139 | Exceptional $53,106 |
| Hawaiians | 89.8 /100 | #140 | Excellent $53,078 |
| Danes | 88.9 /100 | #141 | Excellent $53,041 |
| Immigrants | Armenia | 87.5 /100 | #142 | Excellent $52,986 |
| Swedes | 87.5 /100 | #143 | Excellent $52,986 |
| South American Indians | 87.3 /100 | #144 | Excellent $52,979 |
| Immigrants | Western Europe | 86.7 /100 | #145 | Excellent $52,957 |
| Immigrants | Hungary | 81.6 /100 | #146 | Excellent $52,798 |
| Latvians | 81.0 /100 | #147 | Excellent $52,783 |
| French Canadians | 76.5 /100 | #148 | Good $52,672 |
| Scandinavians | 75.7 /100 | #149 | Good $52,654 |
| Immigrants | Costa Rica | 75.2 /100 | #150 | Good $52,643 |
| Immigrants | Scotland | 75.0 /100 | #151 | Good $52,638 |
Demographics Similar to Immigrants from Thailand by Householder Income Under 25 years
In terms of householder income under 25 years, the demographic groups most similar to Immigrants from Thailand are Cuban ($50,655, a difference of 0.020%), Marshallese ($50,627, a difference of 0.040%), Immigrants from Africa ($50,609, a difference of 0.070%), Immigrants from Micronesia ($50,691, a difference of 0.090%), and Welsh ($50,597, a difference of 0.10%).
| Demographics | Rating | Rank | Householder Income Under 25 years |
| English | 3.3 /100 | #236 | Tragic $50,805 |
| Germans | 3.3 /100 | #237 | Tragic $50,804 |
| Iraqis | 3.2 /100 | #238 | Tragic $50,802 |
| Immigrants | Caribbean | 2.9 /100 | #239 | Tragic $50,757 |
| Immigrants | Lebanon | 2.7 /100 | #240 | Tragic $50,729 |
| Immigrants | Micronesia | 2.5 /100 | #241 | Tragic $50,691 |
| Cubans | 2.3 /100 | #242 | Tragic $50,655 |
| Immigrants | Thailand | 2.2 /100 | #243 | Tragic $50,645 |
| Marshallese | 2.1 /100 | #244 | Tragic $50,627 |
| Immigrants | Africa | 2.0 /100 | #245 | Tragic $50,609 |
| Welsh | 2.0 /100 | #246 | Tragic $50,597 |
| Immigrants | Bosnia and Herzegovina | 1.8 /100 | #247 | Tragic $50,565 |
| Slavs | 1.8 /100 | #248 | Tragic $50,563 |
| Scottish | 1.8 /100 | #249 | Tragic $50,554 |
| Immigrants | Cabo Verde | 1.7 /100 | #250 | Tragic $50,520 |