Hungarian vs Immigrants from Romania Householder Income Under 25 years
COMPARE
Hungarian
Immigrants from Romania
Householder Income Under 25 years
Householder Income Under 25 years Comparison
Hungarians
Immigrants from Romania
$50,247
HOUSEHOLDER INCOME UNDER 25 YEARS
0.9/ 100
METRIC RATING
261st/ 347
METRIC RANK
$55,522
HOUSEHOLDER INCOME UNDER 25 YEARS
100.0/ 100
METRIC RATING
51st/ 347
METRIC RANK
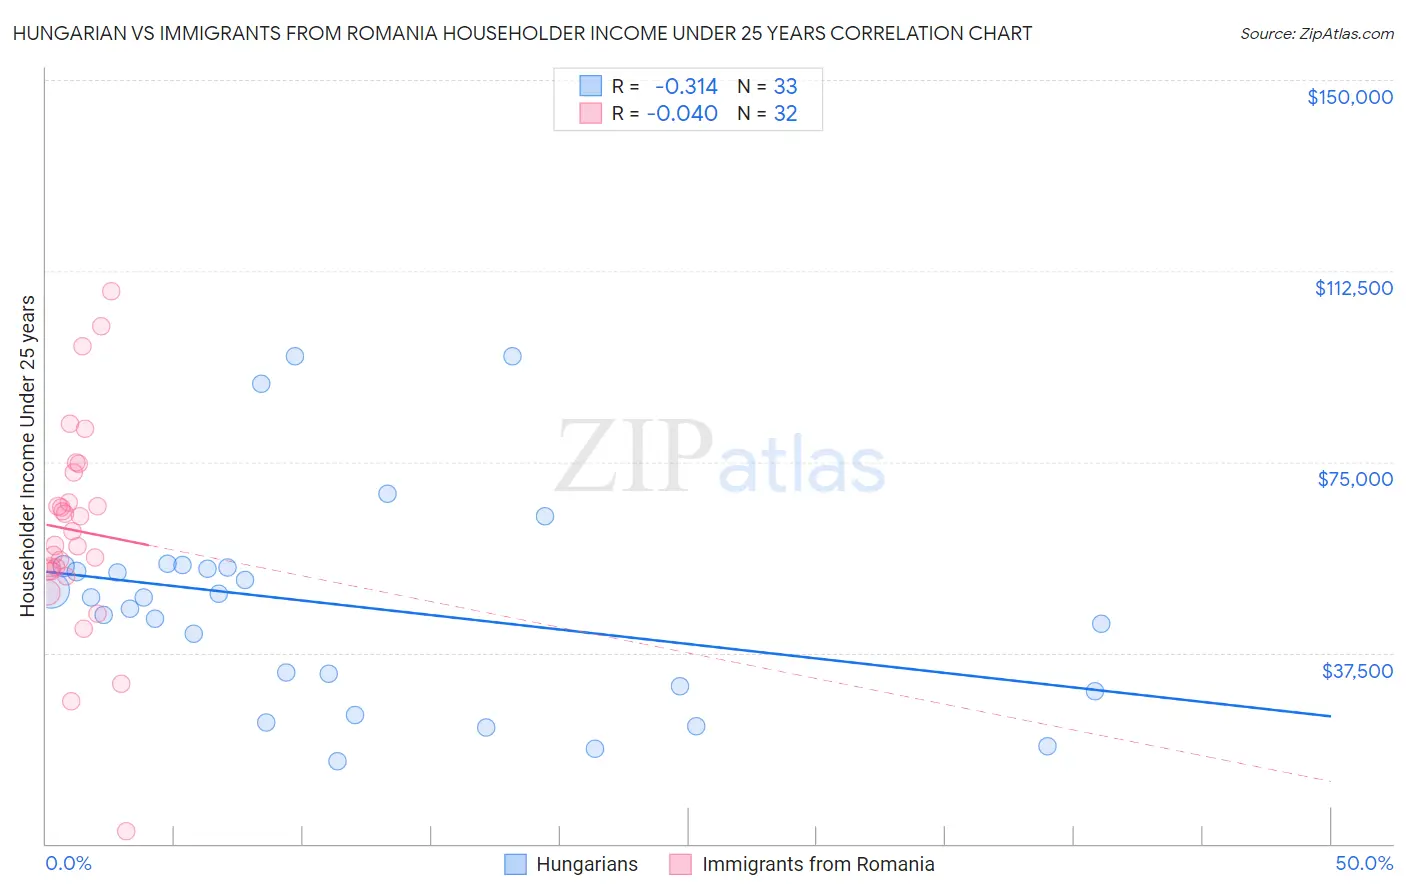
Hungarian vs Immigrants from Romania Householder Income Under 25 years Correlation Chart
The statistical analysis conducted on geographies consisting of 392,087,148 people shows a mild negative correlation between the proportion of Hungarians and household income with householder under the age of 25 in the United States with a correlation coefficient (R) of -0.314 and weighted average of $50,247. Similarly, the statistical analysis conducted on geographies consisting of 223,431,130 people shows no correlation between the proportion of Immigrants from Romania and household income with householder under the age of 25 in the United States with a correlation coefficient (R) of -0.040 and weighted average of $55,522, a difference of 10.5%.
Householder Income Under 25 years Correlation Summary
| Measurement | Hungarian | Immigrants from Romania |
| Minimum | $16,220 | $2,499 |
| Maximum | $95,845 | $108,452 |
| Range | $79,625 | $105,953 |
| Mean | $46,639 | $61,531 |
| Median | $48,413 | $59,956 |
| Interquartile 25% (IQ1) | $30,495 | $53,639 |
| Interquartile 75% (IQ3) | $54,364 | $70,028 |
| Interquartile Range (IQR) | $23,869 | $16,389 |
| Standard Deviation (Sample) | $20,516 | $20,715 |
| Standard Deviation (Population) | $20,203 | $20,389 |
Similar Demographics by Householder Income Under 25 years
Demographics Similar to Hungarians by Householder Income Under 25 years
In terms of householder income under 25 years, the demographic groups most similar to Hungarians are Haitian ($50,231, a difference of 0.030%), Hispanic or Latino ($50,279, a difference of 0.060%), Immigrants from Dominican Republic ($50,204, a difference of 0.090%), Immigrants from Dominica ($50,301, a difference of 0.11%), and White/Caucasian ($50,336, a difference of 0.18%).
| Demographics | Rating | Rank | Householder Income Under 25 years |
| Luxembourgers | 1.2 /100 | #254 | Tragic $50,379 |
| Aleuts | 1.2 /100 | #255 | Tragic $50,377 |
| Immigrants | Cuba | 1.2 /100 | #256 | Tragic $50,374 |
| Lebanese | 1.1 /100 | #257 | Tragic $50,355 |
| Whites/Caucasians | 1.1 /100 | #258 | Tragic $50,336 |
| Immigrants | Dominica | 1.0 /100 | #259 | Tragic $50,301 |
| Hispanics or Latinos | 0.9 /100 | #260 | Tragic $50,279 |
| Hungarians | 0.9 /100 | #261 | Tragic $50,247 |
| Haitians | 0.8 /100 | #262 | Tragic $50,231 |
| Immigrants | Dominican Republic | 0.8 /100 | #263 | Tragic $50,204 |
| Fijians | 0.6 /100 | #264 | Tragic $50,132 |
| Belgians | 0.6 /100 | #265 | Tragic $50,113 |
| Immigrants | Venezuela | 0.6 /100 | #266 | Tragic $50,109 |
| Immigrants | Laos | 0.5 /100 | #267 | Tragic $50,041 |
| Venezuelans | 0.5 /100 | #268 | Tragic $50,011 |
Demographics Similar to Immigrants from Romania by Householder Income Under 25 years
In terms of householder income under 25 years, the demographic groups most similar to Immigrants from Romania are Immigrants from Indonesia ($55,521, a difference of 0.0%), Puget Sound Salish ($55,543, a difference of 0.040%), Iranian ($55,548, a difference of 0.050%), Immigrants from Vietnam ($55,562, a difference of 0.070%), and Spanish American Indian ($55,573, a difference of 0.090%).
| Demographics | Rating | Rank | Householder Income Under 25 years |
| Paraguayans | 100.0 /100 | #44 | Exceptional $55,614 |
| Spanish American Indians | 100.0 /100 | #45 | Exceptional $55,573 |
| Immigrants | Eastern Europe | 100.0 /100 | #46 | Exceptional $55,572 |
| Cambodians | 100.0 /100 | #47 | Exceptional $55,571 |
| Immigrants | Vietnam | 100.0 /100 | #48 | Exceptional $55,562 |
| Iranians | 100.0 /100 | #49 | Exceptional $55,548 |
| Puget Sound Salish | 100.0 /100 | #50 | Exceptional $55,543 |
| Immigrants | Romania | 100.0 /100 | #51 | Exceptional $55,522 |
| Immigrants | Indonesia | 100.0 /100 | #52 | Exceptional $55,521 |
| Immigrants | Poland | 100.0 /100 | #53 | Exceptional $55,474 |
| Sri Lankans | 100.0 /100 | #54 | Exceptional $55,470 |
| Immigrants | Ukraine | 100.0 /100 | #55 | Exceptional $55,447 |
| Salvadorans | 100.0 /100 | #56 | Exceptional $55,412 |
| Soviet Union | 100.0 /100 | #57 | Exceptional $55,340 |
| Guyanese | 99.9 /100 | #58 | Exceptional $55,210 |