Hopi vs Tohono O'odham Householder Income Under 25 years
COMPARE
Hopi
Tohono O'odham
Householder Income Under 25 years
Householder Income Under 25 years Comparison
Hopi
Tohono O'odham
$46,978
HOUSEHOLDER INCOME UNDER 25 YEARS
0.0/ 100
METRIC RATING
317th/ 347
METRIC RANK
$45,248
HOUSEHOLDER INCOME UNDER 25 YEARS
0.0/ 100
METRIC RATING
336th/ 347
METRIC RANK
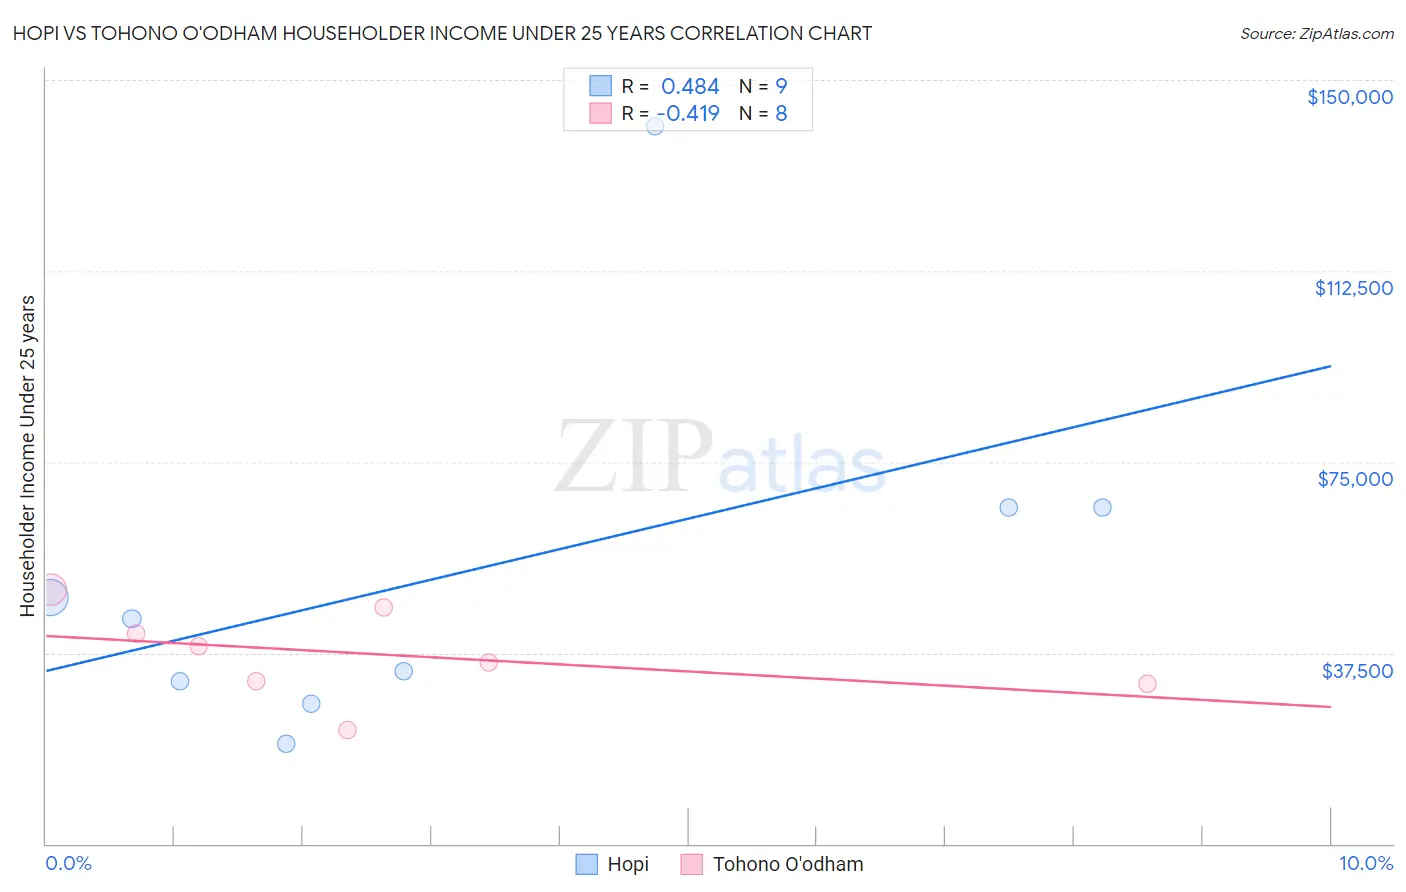
Hopi vs Tohono O'odham Householder Income Under 25 years Correlation Chart
The statistical analysis conducted on geographies consisting of 71,204,870 people shows a moderate positive correlation between the proportion of Hopi and household income with householder under the age of 25 in the United States with a correlation coefficient (R) of 0.484 and weighted average of $46,978. Similarly, the statistical analysis conducted on geographies consisting of 56,811,547 people shows a moderate negative correlation between the proportion of Tohono O'odham and household income with householder under the age of 25 in the United States with a correlation coefficient (R) of -0.419 and weighted average of $45,248, a difference of 3.8%.
Householder Income Under 25 years Correlation Summary
| Measurement | Hopi | Tohono O'odham |
| Minimum | $19,702 | $22,412 |
| Maximum | $140,893 | $49,920 |
| Range | $121,191 | $27,507 |
| Mean | $53,152 | $37,222 |
| Median | $44,111 | $37,258 |
| Interquartile 25% (IQ1) | $29,638 | $31,632 |
| Interquartile 75% (IQ3) | $66,100 | $43,831 |
| Interquartile Range (IQR) | $36,462 | $12,199 |
| Standard Deviation (Sample) | $36,652 | $8,859 |
| Standard Deviation (Population) | $34,555 | $8,287 |
Demographics Similar to Hopi and Tohono O'odham by Householder Income Under 25 years
In terms of householder income under 25 years, the demographic groups most similar to Hopi are Sudanese ($46,982, a difference of 0.010%), Spanish American ($46,913, a difference of 0.14%), African ($46,838, a difference of 0.30%), Immigrants from Sudan ($46,791, a difference of 0.40%), and Potawatomi ($46,462, a difference of 1.1%). Similarly, the demographic groups most similar to Tohono O'odham are Cheyenne ($45,275, a difference of 0.060%), Cajun ($45,338, a difference of 0.20%), Creek ($45,371, a difference of 0.27%), Choctaw ($45,450, a difference of 0.45%), and Immigrants from Zaire ($45,529, a difference of 0.62%).
| Demographics | Rating | Rank | Householder Income Under 25 years |
| Sudanese | 0.0 /100 | #316 | Tragic $46,982 |
| Hopi | 0.0 /100 | #317 | Tragic $46,978 |
| Spanish Americans | 0.0 /100 | #318 | Tragic $46,913 |
| Africans | 0.0 /100 | #319 | Tragic $46,838 |
| Immigrants | Sudan | 0.0 /100 | #320 | Tragic $46,791 |
| Potawatomi | 0.0 /100 | #321 | Tragic $46,462 |
| Sioux | 0.0 /100 | #322 | Tragic $46,417 |
| Immigrants | Saudi Arabia | 0.0 /100 | #323 | Tragic $46,187 |
| Dutch West Indians | 0.0 /100 | #324 | Tragic $45,816 |
| Immigrants | Bahamas | 0.0 /100 | #325 | Tragic $45,793 |
| Osage | 0.0 /100 | #326 | Tragic $45,764 |
| Bahamians | 0.0 /100 | #327 | Tragic $45,743 |
| German Russians | 0.0 /100 | #328 | Tragic $45,673 |
| Seminole | 0.0 /100 | #329 | Tragic $45,649 |
| Indonesians | 0.0 /100 | #330 | Tragic $45,566 |
| Immigrants | Zaire | 0.0 /100 | #331 | Tragic $45,529 |
| Choctaw | 0.0 /100 | #332 | Tragic $45,450 |
| Creek | 0.0 /100 | #333 | Tragic $45,371 |
| Cajuns | 0.0 /100 | #334 | Tragic $45,338 |
| Cheyenne | 0.0 /100 | #335 | Tragic $45,275 |
| Tohono O'odham | 0.0 /100 | #336 | Tragic $45,248 |