Hopi vs Chippewa Householder Income Under 25 years
COMPARE
Hopi
Chippewa
Householder Income Under 25 years
Householder Income Under 25 years Comparison
Hopi
Chippewa
$46,978
HOUSEHOLDER INCOME UNDER 25 YEARS
0.0/ 100
METRIC RATING
317th/ 347
METRIC RANK
$47,015
HOUSEHOLDER INCOME UNDER 25 YEARS
0.0/ 100
METRIC RATING
314th/ 347
METRIC RANK
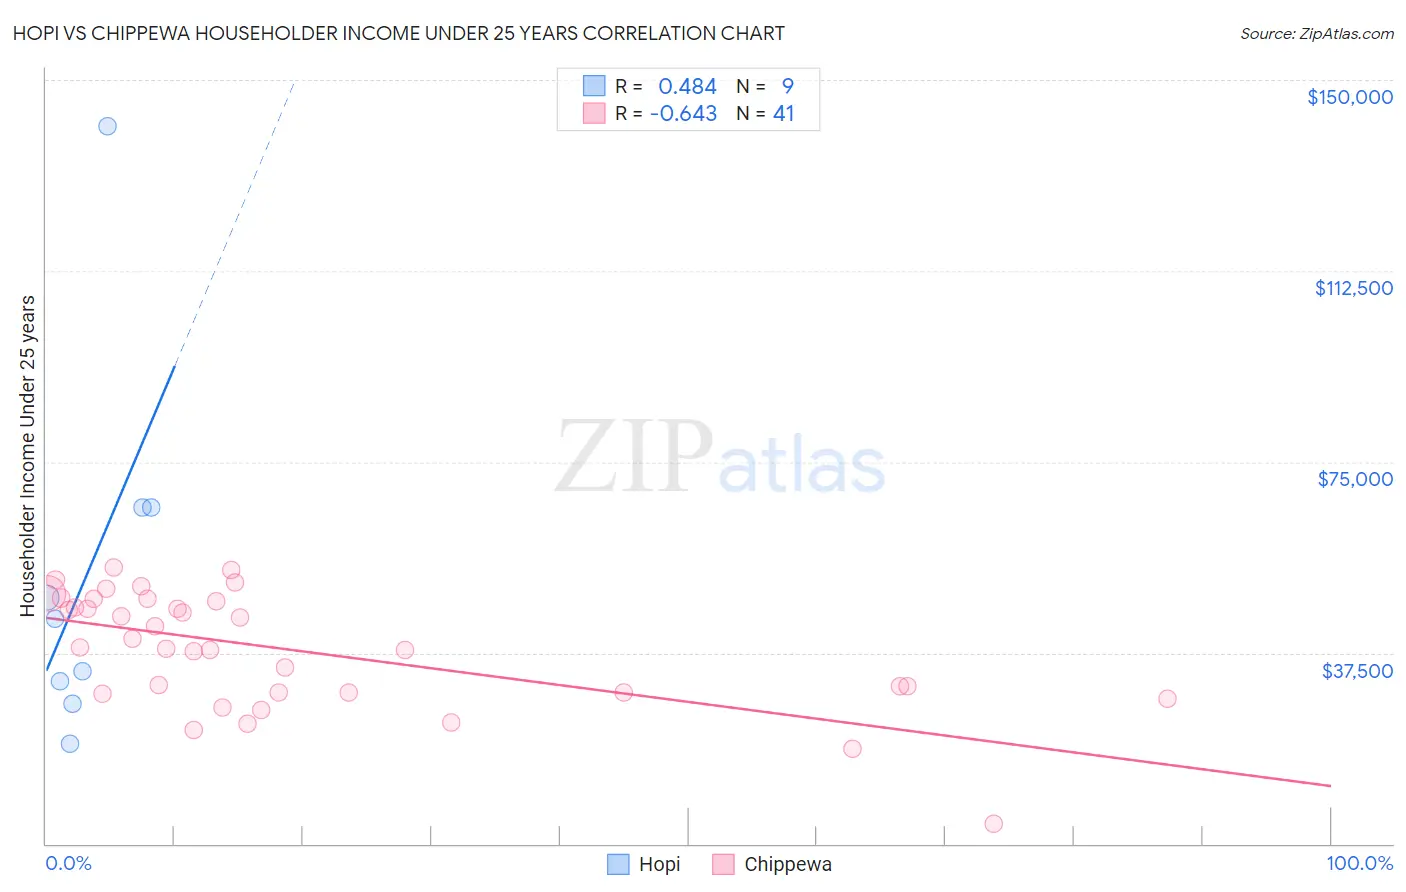
Hopi vs Chippewa Householder Income Under 25 years Correlation Chart
The statistical analysis conducted on geographies consisting of 71,204,870 people shows a moderate positive correlation between the proportion of Hopi and household income with householder under the age of 25 in the United States with a correlation coefficient (R) of 0.484 and weighted average of $46,978. Similarly, the statistical analysis conducted on geographies consisting of 194,849,027 people shows a significant negative correlation between the proportion of Chippewa and household income with householder under the age of 25 in the United States with a correlation coefficient (R) of -0.643 and weighted average of $47,015, a difference of 0.080%.
Householder Income Under 25 years Correlation Summary
| Measurement | Hopi | Chippewa |
| Minimum | $19,702 | $3,854 |
| Maximum | $140,893 | $54,149 |
| Range | $121,191 | $50,295 |
| Mean | $53,152 | $38,206 |
| Median | $44,111 | $38,496 |
| Interquartile 25% (IQ1) | $29,638 | $29,766 |
| Interquartile 75% (IQ3) | $66,100 | $47,898 |
| Interquartile Range (IQR) | $36,462 | $18,132 |
| Standard Deviation (Sample) | $36,652 | $11,315 |
| Standard Deviation (Population) | $34,555 | $11,176 |
Demographics Similar to Hopi and Chippewa by Householder Income Under 25 years
In terms of householder income under 25 years, the demographic groups most similar to Hopi are Sudanese ($46,982, a difference of 0.010%), Crow ($47,012, a difference of 0.070%), Spanish American ($46,913, a difference of 0.14%), African ($46,838, a difference of 0.30%), and Delaware ($47,159, a difference of 0.39%). Similarly, the demographic groups most similar to Chippewa are Crow ($47,012, a difference of 0.010%), Sudanese ($46,982, a difference of 0.070%), Spanish American ($46,913, a difference of 0.22%), Delaware ($47,159, a difference of 0.31%), and African ($46,838, a difference of 0.38%).
| Demographics | Rating | Rank | Householder Income Under 25 years |
| Cherokee | 0.0 /100 | #305 | Tragic $47,848 |
| Natives/Alaskans | 0.0 /100 | #306 | Tragic $47,704 |
| Bangladeshis | 0.0 /100 | #307 | Tragic $47,589 |
| Comanche | 0.0 /100 | #308 | Tragic $47,518 |
| U.S. Virgin Islanders | 0.0 /100 | #309 | Tragic $47,448 |
| Iroquois | 0.0 /100 | #310 | Tragic $47,380 |
| Ottawa | 0.0 /100 | #311 | Tragic $47,366 |
| Bermudans | 0.0 /100 | #312 | Tragic $47,359 |
| Delaware | 0.0 /100 | #313 | Tragic $47,159 |
| Chippewa | 0.0 /100 | #314 | Tragic $47,015 |
| Crow | 0.0 /100 | #315 | Tragic $47,012 |
| Sudanese | 0.0 /100 | #316 | Tragic $46,982 |
| Hopi | 0.0 /100 | #317 | Tragic $46,978 |
| Spanish Americans | 0.0 /100 | #318 | Tragic $46,913 |
| Africans | 0.0 /100 | #319 | Tragic $46,838 |
| Immigrants | Sudan | 0.0 /100 | #320 | Tragic $46,791 |
| Potawatomi | 0.0 /100 | #321 | Tragic $46,462 |
| Sioux | 0.0 /100 | #322 | Tragic $46,417 |
| Immigrants | Saudi Arabia | 0.0 /100 | #323 | Tragic $46,187 |
| Dutch West Indians | 0.0 /100 | #324 | Tragic $45,816 |
| Immigrants | Bahamas | 0.0 /100 | #325 | Tragic $45,793 |