Hopi vs Immigrants from Albania Householder Income Under 25 years
COMPARE
Hopi
Immigrants from Albania
Householder Income Under 25 years
Householder Income Under 25 years Comparison
Hopi
Immigrants from Albania
$46,978
HOUSEHOLDER INCOME UNDER 25 YEARS
0.0/ 100
METRIC RATING
317th/ 347
METRIC RANK
$53,597
HOUSEHOLDER INCOME UNDER 25 YEARS
96.9/ 100
METRIC RATING
115th/ 347
METRIC RANK
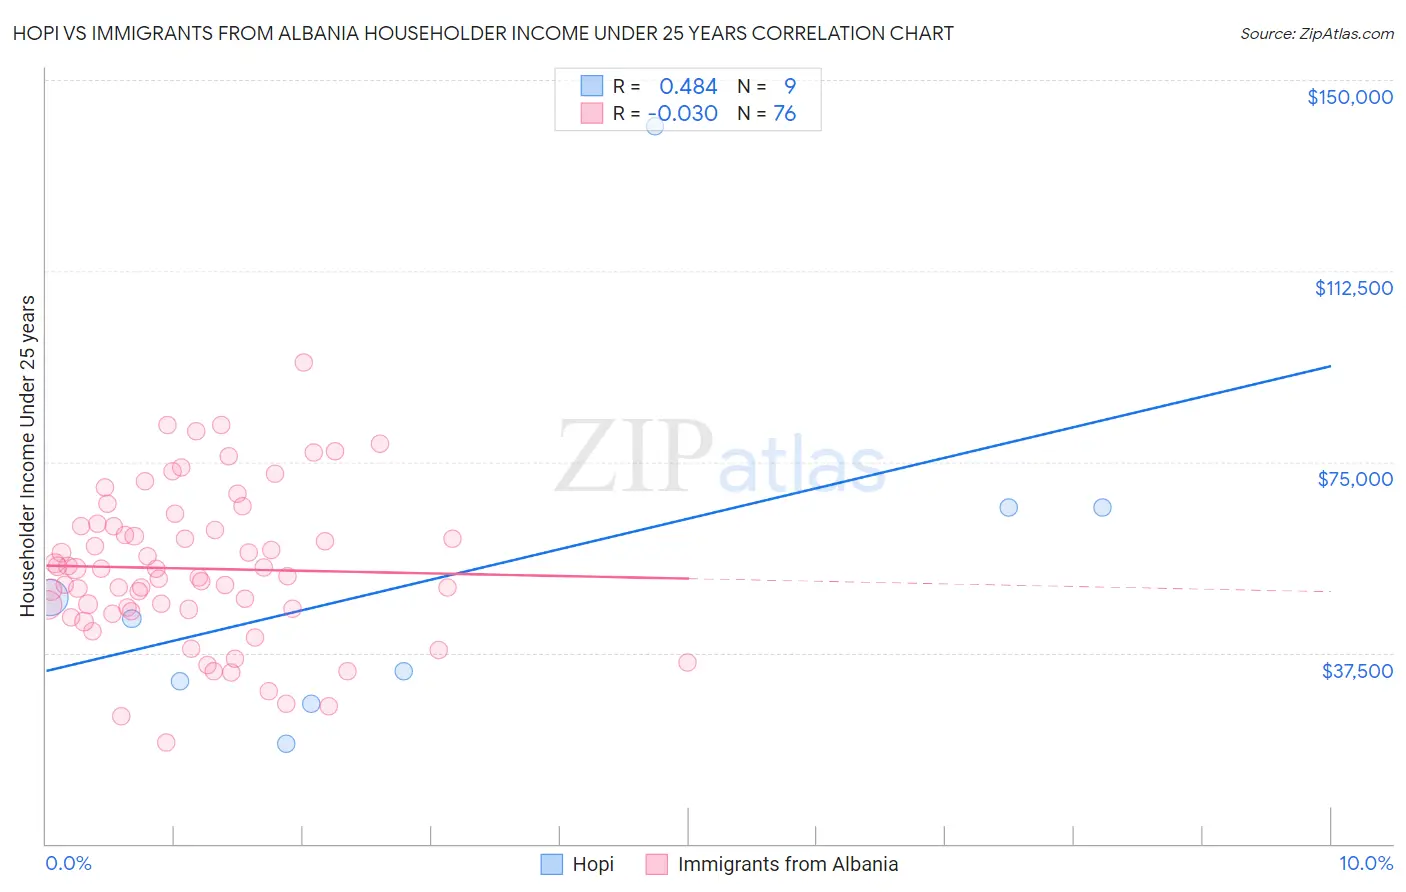
Hopi vs Immigrants from Albania Householder Income Under 25 years Correlation Chart
The statistical analysis conducted on geographies consisting of 71,204,870 people shows a moderate positive correlation between the proportion of Hopi and household income with householder under the age of 25 in the United States with a correlation coefficient (R) of 0.484 and weighted average of $46,978. Similarly, the statistical analysis conducted on geographies consisting of 107,044,611 people shows no correlation between the proportion of Immigrants from Albania and household income with householder under the age of 25 in the United States with a correlation coefficient (R) of -0.030 and weighted average of $53,597, a difference of 14.1%.
Householder Income Under 25 years Correlation Summary
| Measurement | Hopi | Immigrants from Albania |
| Minimum | $19,702 | $19,811 |
| Maximum | $140,893 | $94,545 |
| Range | $121,191 | $74,734 |
| Mean | $53,152 | $54,041 |
| Median | $44,111 | $53,274 |
| Interquartile 25% (IQ1) | $29,638 | $45,869 |
| Interquartile 75% (IQ3) | $66,100 | $62,406 |
| Interquartile Range (IQR) | $36,462 | $16,537 |
| Standard Deviation (Sample) | $36,652 | $14,993 |
| Standard Deviation (Population) | $34,555 | $14,894 |
Similar Demographics by Householder Income Under 25 years
Demographics Similar to Hopi by Householder Income Under 25 years
In terms of householder income under 25 years, the demographic groups most similar to Hopi are Sudanese ($46,982, a difference of 0.010%), Crow ($47,012, a difference of 0.070%), Chippewa ($47,015, a difference of 0.080%), Spanish American ($46,913, a difference of 0.14%), and African ($46,838, a difference of 0.30%).
| Demographics | Rating | Rank | Householder Income Under 25 years |
| Iroquois | 0.0 /100 | #310 | Tragic $47,380 |
| Ottawa | 0.0 /100 | #311 | Tragic $47,366 |
| Bermudans | 0.0 /100 | #312 | Tragic $47,359 |
| Delaware | 0.0 /100 | #313 | Tragic $47,159 |
| Chippewa | 0.0 /100 | #314 | Tragic $47,015 |
| Crow | 0.0 /100 | #315 | Tragic $47,012 |
| Sudanese | 0.0 /100 | #316 | Tragic $46,982 |
| Hopi | 0.0 /100 | #317 | Tragic $46,978 |
| Spanish Americans | 0.0 /100 | #318 | Tragic $46,913 |
| Africans | 0.0 /100 | #319 | Tragic $46,838 |
| Immigrants | Sudan | 0.0 /100 | #320 | Tragic $46,791 |
| Potawatomi | 0.0 /100 | #321 | Tragic $46,462 |
| Sioux | 0.0 /100 | #322 | Tragic $46,417 |
| Immigrants | Saudi Arabia | 0.0 /100 | #323 | Tragic $46,187 |
| Dutch West Indians | 0.0 /100 | #324 | Tragic $45,816 |
Demographics Similar to Immigrants from Albania by Householder Income Under 25 years
In terms of householder income under 25 years, the demographic groups most similar to Immigrants from Albania are Immigrants from Sweden ($53,621, a difference of 0.040%), Romanian ($53,632, a difference of 0.070%), Immigrants from Spain ($53,560, a difference of 0.070%), Lithuanian ($53,552, a difference of 0.080%), and Immigrants from Switzerland ($53,528, a difference of 0.13%).
| Demographics | Rating | Rank | Householder Income Under 25 years |
| Maltese | 97.8 /100 | #108 | Exceptional $53,735 |
| Immigrants | Ecuador | 97.7 /100 | #109 | Exceptional $53,722 |
| Greeks | 97.7 /100 | #110 | Exceptional $53,715 |
| Immigrants | Colombia | 97.7 /100 | #111 | Exceptional $53,714 |
| Immigrants | Oceania | 97.5 /100 | #112 | Exceptional $53,680 |
| Romanians | 97.2 /100 | #113 | Exceptional $53,632 |
| Immigrants | Sweden | 97.1 /100 | #114 | Exceptional $53,621 |
| Immigrants | Albania | 96.9 /100 | #115 | Exceptional $53,597 |
| Immigrants | Spain | 96.6 /100 | #116 | Exceptional $53,560 |
| Lithuanians | 96.6 /100 | #117 | Exceptional $53,552 |
| Immigrants | Switzerland | 96.3 /100 | #118 | Exceptional $53,528 |
| Italians | 95.4 /100 | #119 | Exceptional $53,426 |
| Guamanians/Chamorros | 95.3 /100 | #120 | Exceptional $53,423 |
| Immigrants | Canada | 95.2 /100 | #121 | Exceptional $53,411 |
| Immigrants | Ethiopia | 95.2 /100 | #122 | Exceptional $53,408 |