Cree vs Chippewa Householder Income Under 25 years
COMPARE
Cree
Chippewa
Householder Income Under 25 years
Householder Income Under 25 years Comparison
Cree
Chippewa
$48,514
HOUSEHOLDER INCOME UNDER 25 YEARS
0.0/ 100
METRIC RATING
297th/ 347
METRIC RANK
$47,015
HOUSEHOLDER INCOME UNDER 25 YEARS
0.0/ 100
METRIC RATING
314th/ 347
METRIC RANK
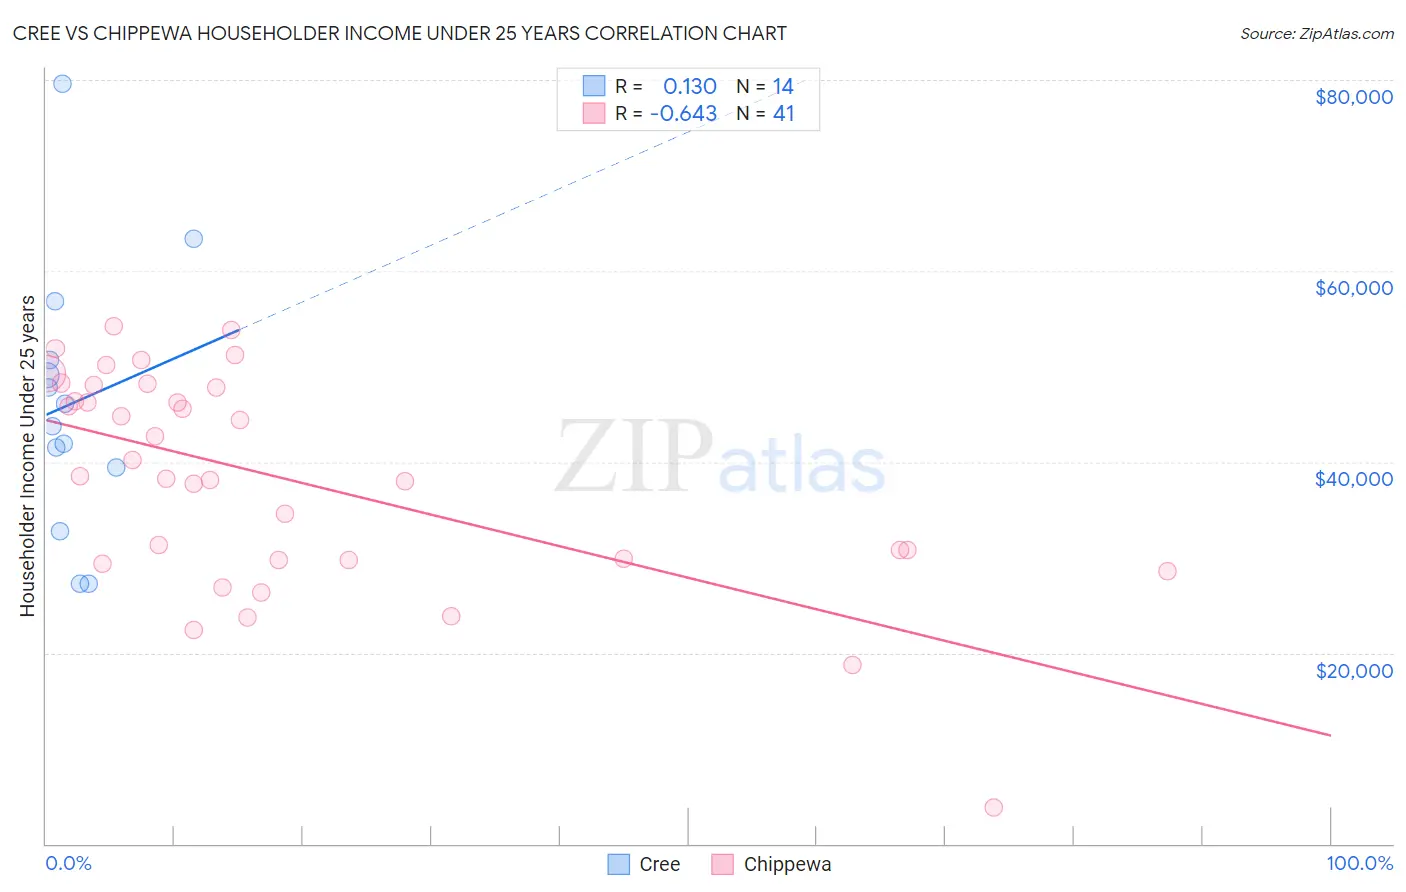
Cree vs Chippewa Householder Income Under 25 years Correlation Chart
The statistical analysis conducted on geographies consisting of 72,438,139 people shows a poor positive correlation between the proportion of Cree and household income with householder under the age of 25 in the United States with a correlation coefficient (R) of 0.130 and weighted average of $48,514. Similarly, the statistical analysis conducted on geographies consisting of 194,849,027 people shows a significant negative correlation between the proportion of Chippewa and household income with householder under the age of 25 in the United States with a correlation coefficient (R) of -0.643 and weighted average of $47,015, a difference of 3.2%.
Householder Income Under 25 years Correlation Summary
| Measurement | Cree | Chippewa |
| Minimum | $27,188 | $3,854 |
| Maximum | $79,562 | $54,149 |
| Range | $52,374 | $50,295 |
| Mean | $46,221 | $38,206 |
| Median | $44,879 | $38,496 |
| Interquartile 25% (IQ1) | $39,375 | $29,766 |
| Interquartile 75% (IQ3) | $50,729 | $47,898 |
| Interquartile Range (IQR) | $11,354 | $18,132 |
| Standard Deviation (Sample) | $14,003 | $11,315 |
| Standard Deviation (Population) | $13,494 | $11,176 |
Demographics Similar to Cree and Chippewa by Householder Income Under 25 years
In terms of householder income under 25 years, the demographic groups most similar to Cree are Blackfeet ($48,603, a difference of 0.18%), Central American Indian ($48,643, a difference of 0.26%), Yaqui ($48,300, a difference of 0.44%), Immigrants from Honduras ($48,267, a difference of 0.51%), and Immigrants from Somalia ($48,135, a difference of 0.79%). Similarly, the demographic groups most similar to Chippewa are Crow ($47,012, a difference of 0.010%), Delaware ($47,159, a difference of 0.31%), Bermudan ($47,359, a difference of 0.73%), Ottawa ($47,366, a difference of 0.75%), and Iroquois ($47,380, a difference of 0.78%).
| Demographics | Rating | Rank | Householder Income Under 25 years |
| Central American Indians | 0.0 /100 | #295 | Tragic $48,643 |
| Blackfeet | 0.0 /100 | #296 | Tragic $48,603 |
| Cree | 0.0 /100 | #297 | Tragic $48,514 |
| Yaqui | 0.0 /100 | #298 | Tragic $48,300 |
| Immigrants | Honduras | 0.0 /100 | #299 | Tragic $48,267 |
| Immigrants | Somalia | 0.0 /100 | #300 | Tragic $48,135 |
| Immigrants | Kuwait | 0.0 /100 | #301 | Tragic $48,126 |
| Immigrants | Liberia | 0.0 /100 | #302 | Tragic $47,981 |
| Immigrants | Middle Africa | 0.0 /100 | #303 | Tragic $47,916 |
| Menominee | 0.0 /100 | #304 | Tragic $47,907 |
| Cherokee | 0.0 /100 | #305 | Tragic $47,848 |
| Natives/Alaskans | 0.0 /100 | #306 | Tragic $47,704 |
| Bangladeshis | 0.0 /100 | #307 | Tragic $47,589 |
| Comanche | 0.0 /100 | #308 | Tragic $47,518 |
| U.S. Virgin Islanders | 0.0 /100 | #309 | Tragic $47,448 |
| Iroquois | 0.0 /100 | #310 | Tragic $47,380 |
| Ottawa | 0.0 /100 | #311 | Tragic $47,366 |
| Bermudans | 0.0 /100 | #312 | Tragic $47,359 |
| Delaware | 0.0 /100 | #313 | Tragic $47,159 |
| Chippewa | 0.0 /100 | #314 | Tragic $47,015 |
| Crow | 0.0 /100 | #315 | Tragic $47,012 |