Immigrants from Bolivia vs Immigrants from Israel Householder Income Over 65 years
COMPARE
Immigrants from Bolivia
Immigrants from Israel
Householder Income Over 65 years
Householder Income Over 65 years Comparison
Immigrants from Bolivia
Immigrants from Israel
$73,434
HOUSEHOLDER INCOME OVER 65 YEARS
100.0/ 100
METRIC RATING
7th/ 347
METRIC RANK
$69,857
HOUSEHOLDER INCOME OVER 65 YEARS
100.0/ 100
METRIC RATING
22nd/ 347
METRIC RANK
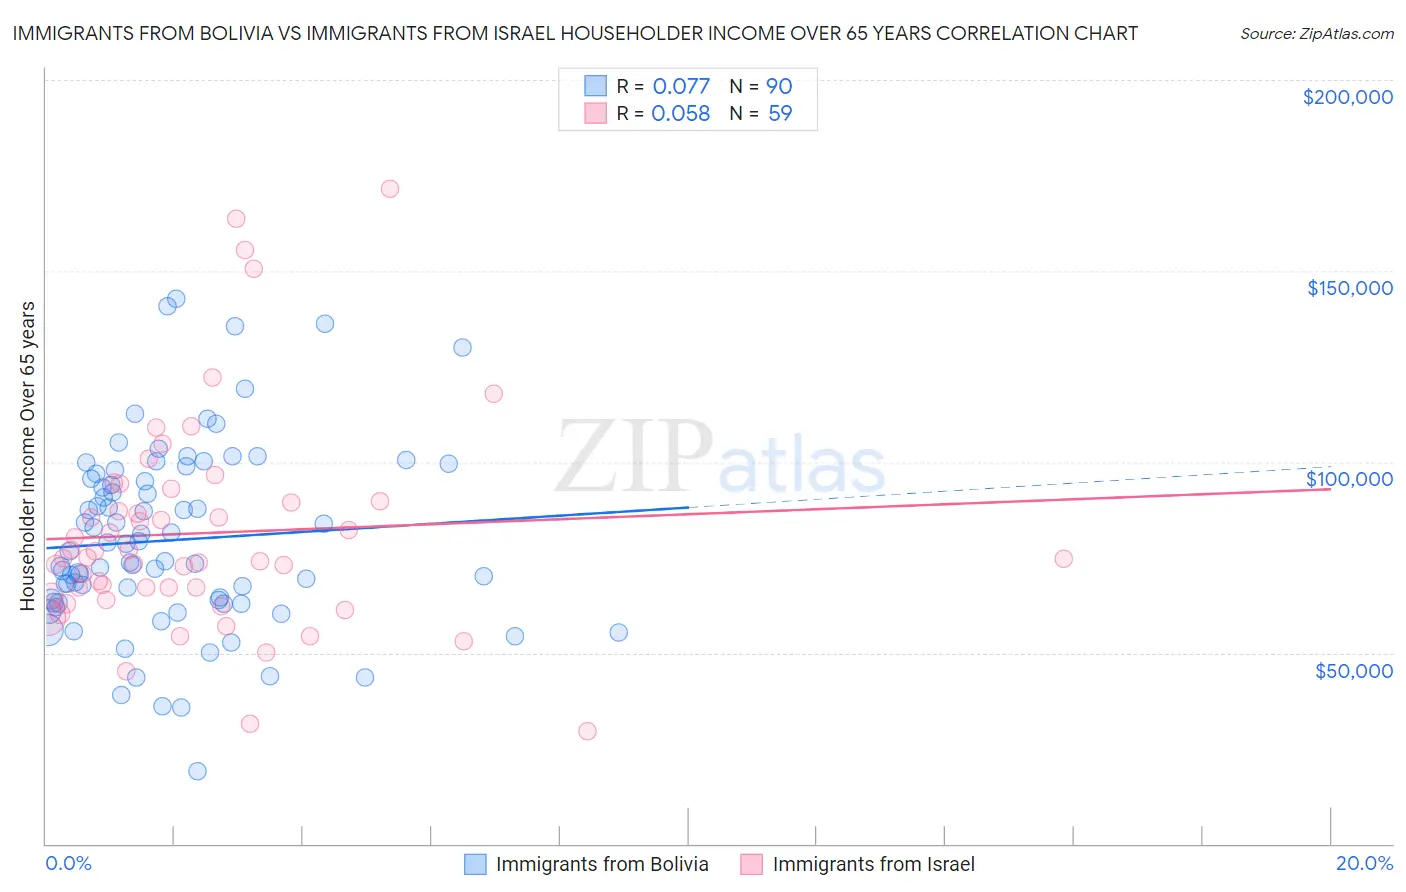
Immigrants from Bolivia vs Immigrants from Israel Householder Income Over 65 years Correlation Chart
The statistical analysis conducted on geographies consisting of 158,593,749 people shows a slight positive correlation between the proportion of Immigrants from Bolivia and household income with householder over the age of 65 in the United States with a correlation coefficient (R) of 0.077 and weighted average of $73,434. Similarly, the statistical analysis conducted on geographies consisting of 209,649,520 people shows a slight positive correlation between the proportion of Immigrants from Israel and household income with householder over the age of 65 in the United States with a correlation coefficient (R) of 0.058 and weighted average of $69,857, a difference of 5.1%.
Householder Income Over 65 years Correlation Summary
| Measurement | Immigrants from Bolivia | Immigrants from Israel |
| Minimum | $19,148 | $29,457 |
| Maximum | $142,587 | $171,563 |
| Range | $123,439 | $142,106 |
| Mean | $79,510 | $81,354 |
| Median | $75,276 | $74,737 |
| Interquartile 25% (IQ1) | $63,072 | $65,166 |
| Interquartile 75% (IQ3) | $95,614 | $89,688 |
| Interquartile Range (IQR) | $32,542 | $24,522 |
| Standard Deviation (Sample) | $24,116 | $28,278 |
| Standard Deviation (Population) | $23,982 | $28,038 |
Demographics Similar to Immigrants from Bolivia and Immigrants from Israel by Householder Income Over 65 years
In terms of householder income over 65 years, the demographic groups most similar to Immigrants from Bolivia are Immigrants from Singapore ($72,963, a difference of 0.65%), Immigrants from India ($72,804, a difference of 0.87%), Bolivian ($74,245, a difference of 1.1%), Bhutanese ($72,288, a difference of 1.6%), and Thai ($72,099, a difference of 1.8%). Similarly, the demographic groups most similar to Immigrants from Israel are Immigrants from Eastern Asia ($69,872, a difference of 0.020%), Immigrants from Japan ($69,774, a difference of 0.12%), Immigrants from Sweden ($69,722, a difference of 0.19%), Immigrants from South Central Asia ($70,103, a difference of 0.35%), and Indian (Asian) ($70,238, a difference of 0.55%).
| Demographics | Rating | Rank | Householder Income Over 65 years |
| Filipinos | 100.0 /100 | #4 | Exceptional $76,686 |
| Immigrants | Iran | 100.0 /100 | #5 | Exceptional $75,081 |
| Bolivians | 100.0 /100 | #6 | Exceptional $74,245 |
| Immigrants | Bolivia | 100.0 /100 | #7 | Exceptional $73,434 |
| Immigrants | Singapore | 100.0 /100 | #8 | Exceptional $72,963 |
| Immigrants | India | 100.0 /100 | #9 | Exceptional $72,804 |
| Bhutanese | 100.0 /100 | #10 | Exceptional $72,288 |
| Thais | 100.0 /100 | #11 | Exceptional $72,099 |
| Cypriots | 100.0 /100 | #12 | Exceptional $71,714 |
| Immigrants | Hong Kong | 100.0 /100 | #13 | Exceptional $71,567 |
| Burmese | 100.0 /100 | #14 | Exceptional $71,139 |
| Native Hawaiians | 100.0 /100 | #15 | Exceptional $71,021 |
| Okinawans | 100.0 /100 | #16 | Exceptional $70,846 |
| Immigrants | Korea | 100.0 /100 | #17 | Exceptional $70,696 |
| Eastern Europeans | 100.0 /100 | #18 | Exceptional $70,470 |
| Indians (Asian) | 100.0 /100 | #19 | Exceptional $70,238 |
| Immigrants | South Central Asia | 100.0 /100 | #20 | Exceptional $70,103 |
| Immigrants | Eastern Asia | 100.0 /100 | #21 | Exceptional $69,872 |
| Immigrants | Israel | 100.0 /100 | #22 | Exceptional $69,857 |
| Immigrants | Japan | 100.0 /100 | #23 | Exceptional $69,774 |
| Immigrants | Sweden | 100.0 /100 | #24 | Exceptional $69,722 |