Colombian vs Yugoslavian Median Male Earnings
COMPARE
Colombian
Yugoslavian
Median Male Earnings
Median Male Earnings Comparison
Colombians
Yugoslavians
$53,832
MEDIAN MALE EARNINGS
34.4/ 100
METRIC RATING
186th/ 347
METRIC RANK
$53,967
MEDIAN MALE EARNINGS
37.4/ 100
METRIC RATING
182nd/ 347
METRIC RANK
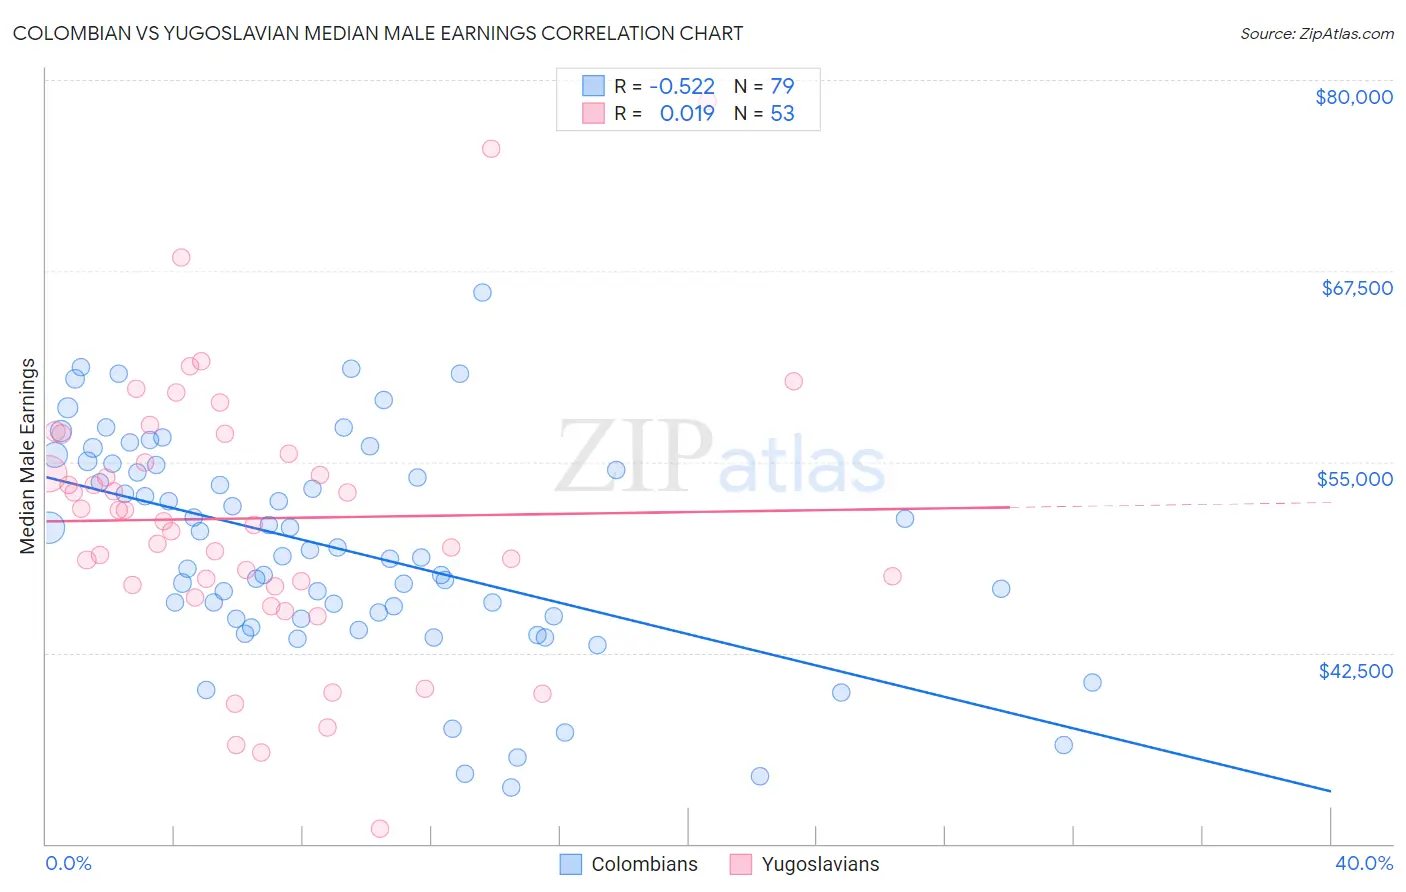
Colombian vs Yugoslavian Median Male Earnings Correlation Chart
The statistical analysis conducted on geographies consisting of 419,486,746 people shows a substantial negative correlation between the proportion of Colombians and median male earnings in the United States with a correlation coefficient (R) of -0.522 and weighted average of $53,832. Similarly, the statistical analysis conducted on geographies consisting of 285,670,858 people shows no correlation between the proportion of Yugoslavians and median male earnings in the United States with a correlation coefficient (R) of 0.019 and weighted average of $53,967, a difference of 0.25%.
Median Male Earnings Correlation Summary
| Measurement | Colombian | Yugoslavian |
| Minimum | $33,656 | $30,961 |
| Maximum | $66,073 | $78,594 |
| Range | $32,417 | $47,633 |
| Mean | $49,309 | $51,302 |
| Median | $48,805 | $51,102 |
| Interquartile 25% (IQ1) | $44,741 | $46,894 |
| Interquartile 75% (IQ3) | $54,777 | $56,167 |
| Interquartile Range (IQR) | $10,037 | $9,274 |
| Standard Deviation (Sample) | $7,074 | $8,961 |
| Standard Deviation (Population) | $7,029 | $8,876 |
Demographics Similar to Colombians and Yugoslavians by Median Male Earnings
In terms of median male earnings, the demographic groups most similar to Colombians are Immigrants from Sierra Leone ($53,905, a difference of 0.14%), White/Caucasian ($53,925, a difference of 0.17%), Immigrants from Eritrea ($53,715, a difference of 0.22%), Immigrants from Eastern Africa ($53,713, a difference of 0.22%), and Immigrants from South America ($53,962, a difference of 0.24%). Similarly, the demographic groups most similar to Yugoslavians are Immigrants from South America ($53,962, a difference of 0.010%), White/Caucasian ($53,925, a difference of 0.080%), Immigrants from Sierra Leone ($53,905, a difference of 0.11%), Immigrants ($54,168, a difference of 0.37%), and Iraqi ($54,182, a difference of 0.40%).
| Demographics | Rating | Rank | Median Male Earnings |
| South Americans | 50.0 /100 | #174 | Average $54,492 |
| Dutch | 48.0 /100 | #175 | Average $54,410 |
| Spaniards | 47.8 /100 | #176 | Average $54,401 |
| Costa Ricans | 44.8 /100 | #177 | Average $54,279 |
| Sierra Leoneans | 44.8 /100 | #178 | Average $54,279 |
| Celtics | 43.9 /100 | #179 | Average $54,242 |
| Iraqis | 42.5 /100 | #180 | Average $54,182 |
| Immigrants | Immigrants | 42.1 /100 | #181 | Average $54,168 |
| Yugoslavians | 37.4 /100 | #182 | Fair $53,967 |
| Immigrants | South America | 37.3 /100 | #183 | Fair $53,962 |
| Whites/Caucasians | 36.5 /100 | #184 | Fair $53,925 |
| Immigrants | Sierra Leone | 36.0 /100 | #185 | Fair $53,905 |
| Colombians | 34.4 /100 | #186 | Fair $53,832 |
| Immigrants | Eritrea | 31.8 /100 | #187 | Fair $53,715 |
| Immigrants | Eastern Africa | 31.8 /100 | #188 | Fair $53,713 |
| Puget Sound Salish | 31.6 /100 | #189 | Fair $53,704 |
| Uruguayans | 31.1 /100 | #190 | Fair $53,680 |
| Guamanians/Chamorros | 30.7 /100 | #191 | Fair $53,661 |
| Scotch-Irish | 30.6 /100 | #192 | Fair $53,658 |
| Kenyans | 30.4 /100 | #193 | Fair $53,647 |
| Spanish | 29.0 /100 | #194 | Fair $53,576 |