Nepalese vs Delaware Householder Income Over 65 years
COMPARE
Nepalese
Delaware
Householder Income Over 65 years
Householder Income Over 65 years Comparison
Nepalese
Delaware
$58,761
HOUSEHOLDER INCOME OVER 65 YEARS
9.0/ 100
METRIC RATING
214th/ 347
METRIC RANK
$58,214
HOUSEHOLDER INCOME OVER 65 YEARS
5.3/ 100
METRIC RATING
222nd/ 347
METRIC RANK
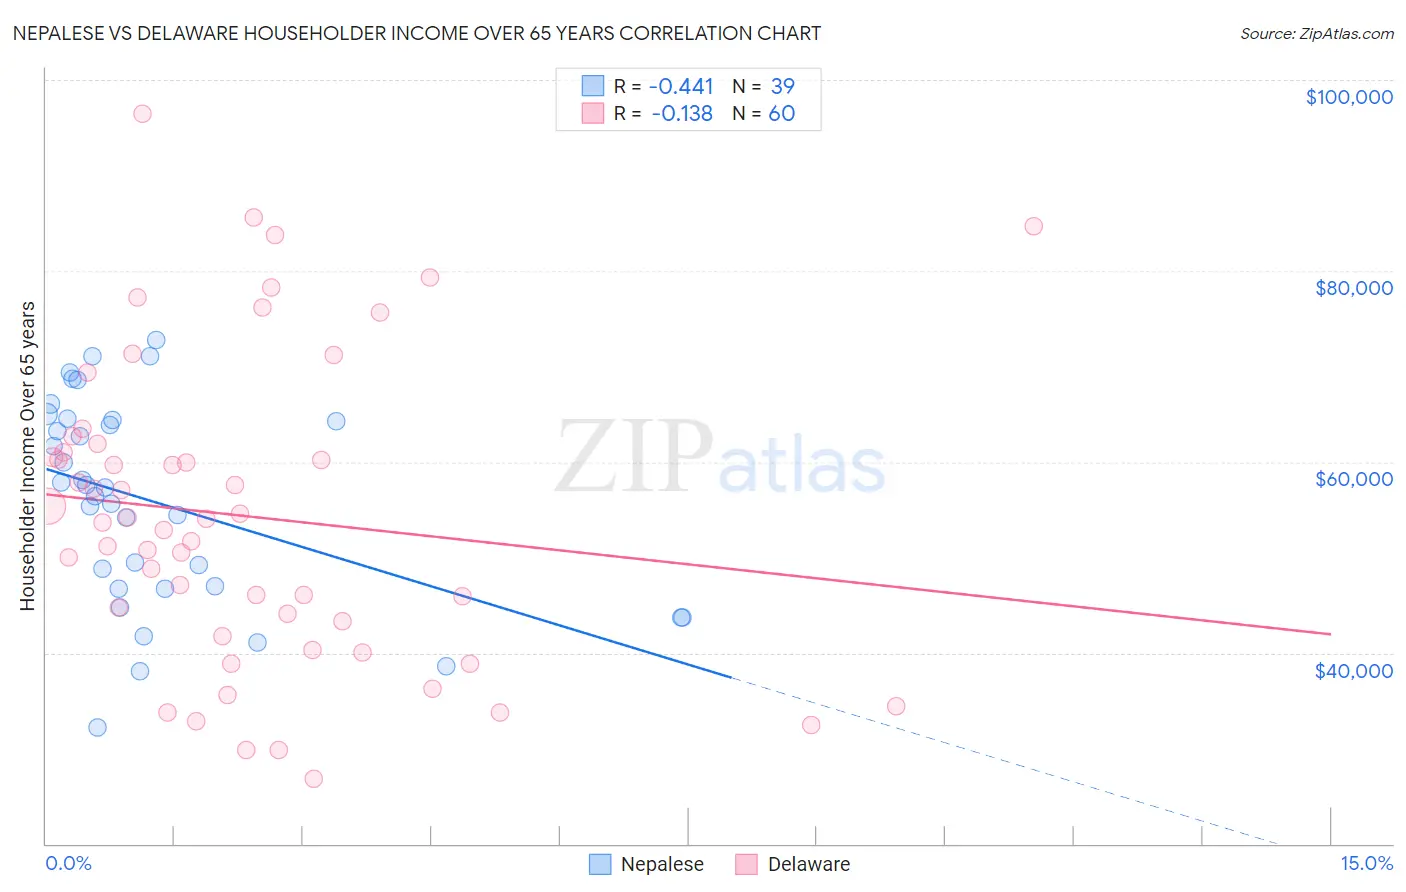
Nepalese vs Delaware Householder Income Over 65 years Correlation Chart
The statistical analysis conducted on geographies consisting of 24,501,136 people shows a moderate negative correlation between the proportion of Nepalese and household income with householder over the age of 65 in the United States with a correlation coefficient (R) of -0.441 and weighted average of $58,761. Similarly, the statistical analysis conducted on geographies consisting of 96,156,233 people shows a poor negative correlation between the proportion of Delaware and household income with householder over the age of 65 in the United States with a correlation coefficient (R) of -0.138 and weighted average of $58,214, a difference of 0.94%.
Householder Income Over 65 years Correlation Summary
| Measurement | Nepalese | Delaware |
| Minimum | $32,174 | $26,761 |
| Maximum | $72,725 | $96,428 |
| Range | $40,551 | $69,667 |
| Mean | $55,785 | $54,295 |
| Median | $57,344 | $53,817 |
| Interquartile 25% (IQ1) | $46,756 | $42,460 |
| Interquartile 75% (IQ3) | $64,405 | $61,428 |
| Interquartile Range (IQR) | $17,649 | $18,968 |
| Standard Deviation (Sample) | $10,626 | $15,959 |
| Standard Deviation (Population) | $10,489 | $15,825 |
Demographics Similar to Nepalese and Delaware by Householder Income Over 65 years
In terms of householder income over 65 years, the demographic groups most similar to Nepalese are Colombian ($58,851, a difference of 0.15%), White/Caucasian ($58,847, a difference of 0.15%), Immigrants from Ghana ($58,624, a difference of 0.23%), Immigrants from Nigeria ($58,942, a difference of 0.31%), and Nigerian ($58,992, a difference of 0.39%). Similarly, the demographic groups most similar to Delaware are Immigrants from El Salvador ($58,226, a difference of 0.020%), Tsimshian ($58,202, a difference of 0.020%), Malaysian ($58,244, a difference of 0.050%), Yugoslavian ($58,243, a difference of 0.050%), and Bermudan ($58,171, a difference of 0.080%).
| Demographics | Rating | Rank | Householder Income Over 65 years |
| Uruguayans | 12.3 /100 | #208 | Poor $59,090 |
| Slovaks | 11.7 /100 | #209 | Poor $59,039 |
| Nigerians | 11.2 /100 | #210 | Poor $58,992 |
| Immigrants | Nigeria | 10.7 /100 | #211 | Poor $58,942 |
| Colombians | 9.8 /100 | #212 | Tragic $58,851 |
| Whites/Caucasians | 9.8 /100 | #213 | Tragic $58,847 |
| Nepalese | 9.0 /100 | #214 | Tragic $58,761 |
| Immigrants | Ghana | 7.9 /100 | #215 | Tragic $58,624 |
| Immigrants | Middle Africa | 6.2 /100 | #216 | Tragic $58,375 |
| Sudanese | 5.7 /100 | #217 | Tragic $58,281 |
| Panamanians | 5.6 /100 | #218 | Tragic $58,266 |
| Malaysians | 5.5 /100 | #219 | Tragic $58,244 |
| Yugoslavians | 5.5 /100 | #220 | Tragic $58,243 |
| Immigrants | El Salvador | 5.4 /100 | #221 | Tragic $58,226 |
| Delaware | 5.3 /100 | #222 | Tragic $58,214 |
| Tsimshian | 5.2 /100 | #223 | Tragic $58,202 |
| Bermudans | 5.1 /100 | #224 | Tragic $58,171 |
| Venezuelans | 4.4 /100 | #225 | Tragic $58,026 |
| French Canadians | 4.2 /100 | #226 | Tragic $57,975 |
| Japanese | 3.9 /100 | #227 | Tragic $57,919 |
| Immigrants | Albania | 3.6 /100 | #228 | Tragic $57,828 |