Ghanaian vs Immigrants from North Macedonia Householder Income Ages 25 - 44 years
COMPARE
Ghanaian
Immigrants from North Macedonia
Householder Income Ages 25 - 44 years
Householder Income Ages 25 - 44 years Comparison
Ghanaians
Immigrants from North Macedonia
$90,137
HOUSEHOLDER INCOME AGES 25 - 44 YEARS
7.9/ 100
METRIC RATING
216th/ 347
METRIC RANK
$100,101
HOUSEHOLDER INCOME AGES 25 - 44 YEARS
95.6/ 100
METRIC RATING
109th/ 347
METRIC RANK
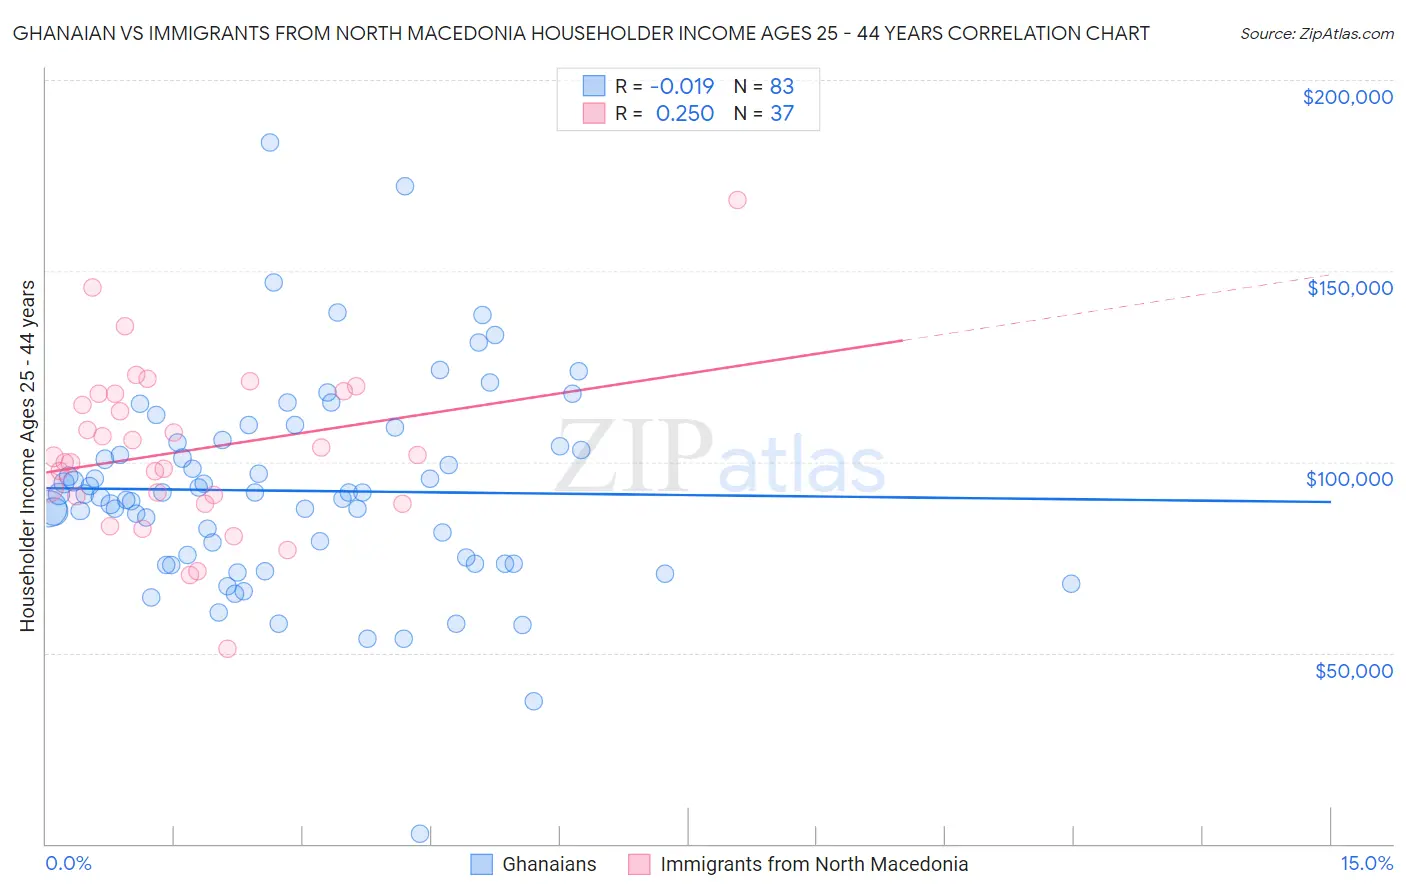
Ghanaian vs Immigrants from North Macedonia Householder Income Ages 25 - 44 years Correlation Chart
The statistical analysis conducted on geographies consisting of 190,400,180 people shows no correlation between the proportion of Ghanaians and household income with householder between the ages 25 and 44 in the United States with a correlation coefficient (R) of -0.019 and weighted average of $90,137. Similarly, the statistical analysis conducted on geographies consisting of 74,266,818 people shows a weak positive correlation between the proportion of Immigrants from North Macedonia and household income with householder between the ages 25 and 44 in the United States with a correlation coefficient (R) of 0.250 and weighted average of $100,101, a difference of 11.1%.
Householder Income Ages 25 - 44 years Correlation Summary
| Measurement | Ghanaian | Immigrants from North Macedonia |
| Minimum | $2,499 | $51,151 |
| Maximum | $183,644 | $168,534 |
| Range | $181,145 | $117,383 |
| Mean | $92,427 | $102,890 |
| Median | $91,588 | $101,325 |
| Interquartile 25% (IQ1) | $73,476 | $89,993 |
| Interquartile 75% (IQ3) | $104,966 | $117,844 |
| Interquartile Range (IQR) | $31,489 | $27,851 |
| Standard Deviation (Sample) | $27,016 | $21,872 |
| Standard Deviation (Population) | $26,853 | $21,575 |
Similar Demographics by Householder Income Ages 25 - 44 years
Demographics Similar to Ghanaians by Householder Income Ages 25 - 44 years
In terms of householder income ages 25 - 44 years, the demographic groups most similar to Ghanaians are Panamanian ($90,193, a difference of 0.060%), Scotch-Irish ($89,969, a difference of 0.19%), Guyanese ($89,940, a difference of 0.22%), Immigrants from Africa ($90,372, a difference of 0.26%), and Delaware ($89,876, a difference of 0.29%).
| Demographics | Rating | Rank | Householder Income Ages 25 - 44 years |
| Immigrants | Uruguay | 13.2 /100 | #209 | Poor $91,171 |
| Immigrants | Kenya | 10.9 /100 | #210 | Poor $90,767 |
| Iraqis | 10.8 /100 | #211 | Poor $90,764 |
| Hawaiians | 10.6 /100 | #212 | Poor $90,722 |
| Immigrants | Bangladesh | 9.3 /100 | #213 | Tragic $90,448 |
| Immigrants | Africa | 8.9 /100 | #214 | Tragic $90,372 |
| Panamanians | 8.1 /100 | #215 | Tragic $90,193 |
| Ghanaians | 7.9 /100 | #216 | Tragic $90,137 |
| Scotch-Irish | 7.3 /100 | #217 | Tragic $89,969 |
| Guyanese | 7.1 /100 | #218 | Tragic $89,940 |
| Delaware | 6.9 /100 | #219 | Tragic $89,876 |
| Trinidadians and Tobagonians | 6.8 /100 | #220 | Tragic $89,856 |
| Immigrants | Trinidad and Tobago | 6.5 /100 | #221 | Tragic $89,748 |
| Immigrants | Ecuador | 6.2 /100 | #222 | Tragic $89,673 |
| Immigrants | Guyana | 5.9 /100 | #223 | Tragic $89,586 |
Demographics Similar to Immigrants from North Macedonia by Householder Income Ages 25 - 44 years
In terms of householder income ages 25 - 44 years, the demographic groups most similar to Immigrants from North Macedonia are Immigrants from Afghanistan ($99,977, a difference of 0.12%), Immigrants from South Eastern Asia ($100,283, a difference of 0.18%), Chilean ($99,900, a difference of 0.20%), Northern European ($100,457, a difference of 0.36%), and Polish ($99,685, a difference of 0.42%).
| Demographics | Rating | Rank | Householder Income Ages 25 - 44 years |
| Immigrants | Lebanon | 97.4 /100 | #102 | Exceptional $101,124 |
| Immigrants | Moldova | 97.4 /100 | #103 | Exceptional $101,091 |
| Immigrants | Poland | 97.4 /100 | #104 | Exceptional $101,065 |
| Immigrants | Vietnam | 96.5 /100 | #105 | Exceptional $100,535 |
| Immigrants | Brazil | 96.5 /100 | #106 | Exceptional $100,534 |
| Northern Europeans | 96.3 /100 | #107 | Exceptional $100,457 |
| Immigrants | South Eastern Asia | 96.0 /100 | #108 | Exceptional $100,283 |
| Immigrants | North Macedonia | 95.6 /100 | #109 | Exceptional $100,101 |
| Immigrants | Afghanistan | 95.3 /100 | #110 | Exceptional $99,977 |
| Chileans | 95.1 /100 | #111 | Exceptional $99,900 |
| Poles | 94.5 /100 | #112 | Exceptional $99,685 |
| Tongans | 94.2 /100 | #113 | Exceptional $99,604 |
| Immigrants | Western Asia | 94.0 /100 | #114 | Exceptional $99,516 |
| Carpatho Rusyns | 93.7 /100 | #115 | Exceptional $99,449 |
| Portuguese | 93.7 /100 | #116 | Exceptional $99,429 |