French vs Indonesian Per Capita Income
COMPARE
French
Indonesian
Per Capita Income
Per Capita Income Comparison
French
Indonesians
$43,685
PER CAPITA INCOME
50.7/ 100
METRIC RATING
173rd/ 347
METRIC RANK
$37,300
PER CAPITA INCOME
0.1/ 100
METRIC RATING
296th/ 347
METRIC RANK
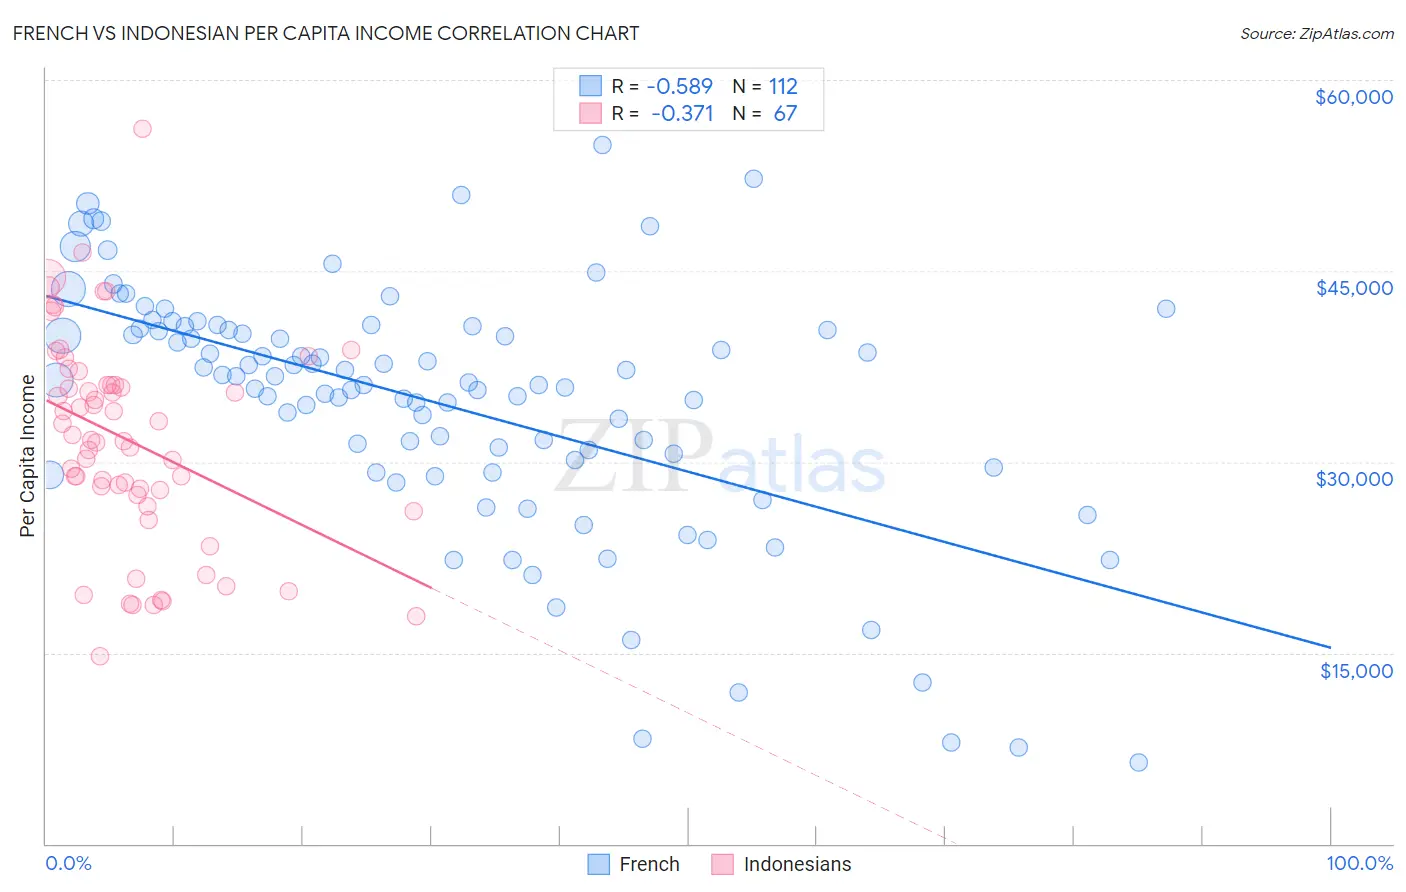
French vs Indonesian Per Capita Income Correlation Chart
The statistical analysis conducted on geographies consisting of 572,484,193 people shows a substantial negative correlation between the proportion of French and per capita income in the United States with a correlation coefficient (R) of -0.589 and weighted average of $43,685. Similarly, the statistical analysis conducted on geographies consisting of 162,740,842 people shows a mild negative correlation between the proportion of Indonesians and per capita income in the United States with a correlation coefficient (R) of -0.371 and weighted average of $37,300, a difference of 17.1%.
Per Capita Income Correlation Summary
| Measurement | French | Indonesian |
| Minimum | $6,335 | $14,779 |
| Maximum | $54,853 | $56,163 |
| Range | $48,518 | $41,384 |
| Mean | $34,598 | $31,679 |
| Median | $36,348 | $31,763 |
| Interquartile 25% (IQ1) | $29,890 | $27,405 |
| Interquartile 75% (IQ3) | $40,437 | $36,017 |
| Interquartile Range (IQR) | $10,547 | $8,612 |
| Standard Deviation (Sample) | $9,750 | $8,209 |
| Standard Deviation (Population) | $9,706 | $8,147 |
Similar Demographics by Per Capita Income
Demographics Similar to French by Per Capita Income
In terms of per capita income, the demographic groups most similar to French are Colombian ($43,661, a difference of 0.060%), Celtic ($43,621, a difference of 0.15%), Czechoslovakian ($43,806, a difference of 0.28%), Immigrants from South Eastern Asia ($43,539, a difference of 0.34%), and Immigrants from Eastern Africa ($43,838, a difference of 0.35%).
| Demographics | Rating | Rank | Per Capita Income |
| Immigrants | Uruguay | 59.3 /100 | #166 | Average $43,997 |
| English | 58.9 /100 | #167 | Average $43,982 |
| Belgians | 58.1 /100 | #168 | Average $43,951 |
| Immigrants | Peru | 55.3 /100 | #169 | Average $43,852 |
| Scandinavians | 55.2 /100 | #170 | Average $43,848 |
| Immigrants | Eastern Africa | 54.9 /100 | #171 | Average $43,838 |
| Czechoslovakians | 54.1 /100 | #172 | Average $43,806 |
| French | 50.7 /100 | #173 | Average $43,685 |
| Colombians | 50.0 /100 | #174 | Average $43,661 |
| Celtics | 48.9 /100 | #175 | Average $43,621 |
| Immigrants | South Eastern Asia | 46.6 /100 | #176 | Average $43,539 |
| Tlingit-Haida | 45.9 /100 | #177 | Average $43,516 |
| Immigrants | Costa Rica | 44.5 /100 | #178 | Average $43,464 |
| Finns | 44.4 /100 | #179 | Average $43,461 |
| Sierra Leoneans | 42.9 /100 | #180 | Average $43,405 |
Demographics Similar to Indonesians by Per Capita Income
In terms of per capita income, the demographic groups most similar to Indonesians are Immigrants from Dominican Republic ($37,306, a difference of 0.020%), Haitian ($37,289, a difference of 0.030%), Immigrants from Caribbean ($37,254, a difference of 0.12%), Cuban ($37,383, a difference of 0.22%), and Cherokee ($37,203, a difference of 0.26%).
| Demographics | Rating | Rank | Per Capita Income |
| U.S. Virgin Islanders | 0.1 /100 | #289 | Tragic $37,589 |
| Immigrants | Guatemala | 0.1 /100 | #290 | Tragic $37,550 |
| Cajuns | 0.1 /100 | #291 | Tragic $37,527 |
| Immigrants | Micronesia | 0.1 /100 | #292 | Tragic $37,464 |
| Mexican American Indians | 0.1 /100 | #293 | Tragic $37,407 |
| Cubans | 0.1 /100 | #294 | Tragic $37,383 |
| Immigrants | Dominican Republic | 0.1 /100 | #295 | Tragic $37,306 |
| Indonesians | 0.1 /100 | #296 | Tragic $37,300 |
| Haitians | 0.1 /100 | #297 | Tragic $37,289 |
| Immigrants | Caribbean | 0.1 /100 | #298 | Tragic $37,254 |
| Cherokee | 0.1 /100 | #299 | Tragic $37,203 |
| Immigrants | Bahamas | 0.1 /100 | #300 | Tragic $37,193 |
| Ottawa | 0.1 /100 | #301 | Tragic $37,101 |
| Shoshone | 0.1 /100 | #302 | Tragic $37,072 |
| Paiute | 0.1 /100 | #303 | Tragic $37,066 |