French vs Iroquois Female Poverty Among 18-24 Year Olds
COMPARE
French
Iroquois
Female Poverty Among 18-24 Year Olds
Female Poverty Among 18-24 Year Olds Comparison
French
Iroquois
20.7%
FEMALE POVERTY AMONG 18-24 YEAR OLDS
7.9/ 100
METRIC RATING
223rd/ 347
METRIC RANK
22.9%
FEMALE POVERTY AMONG 18-24 YEAR OLDS
0.0/ 100
METRIC RATING
302nd/ 347
METRIC RANK
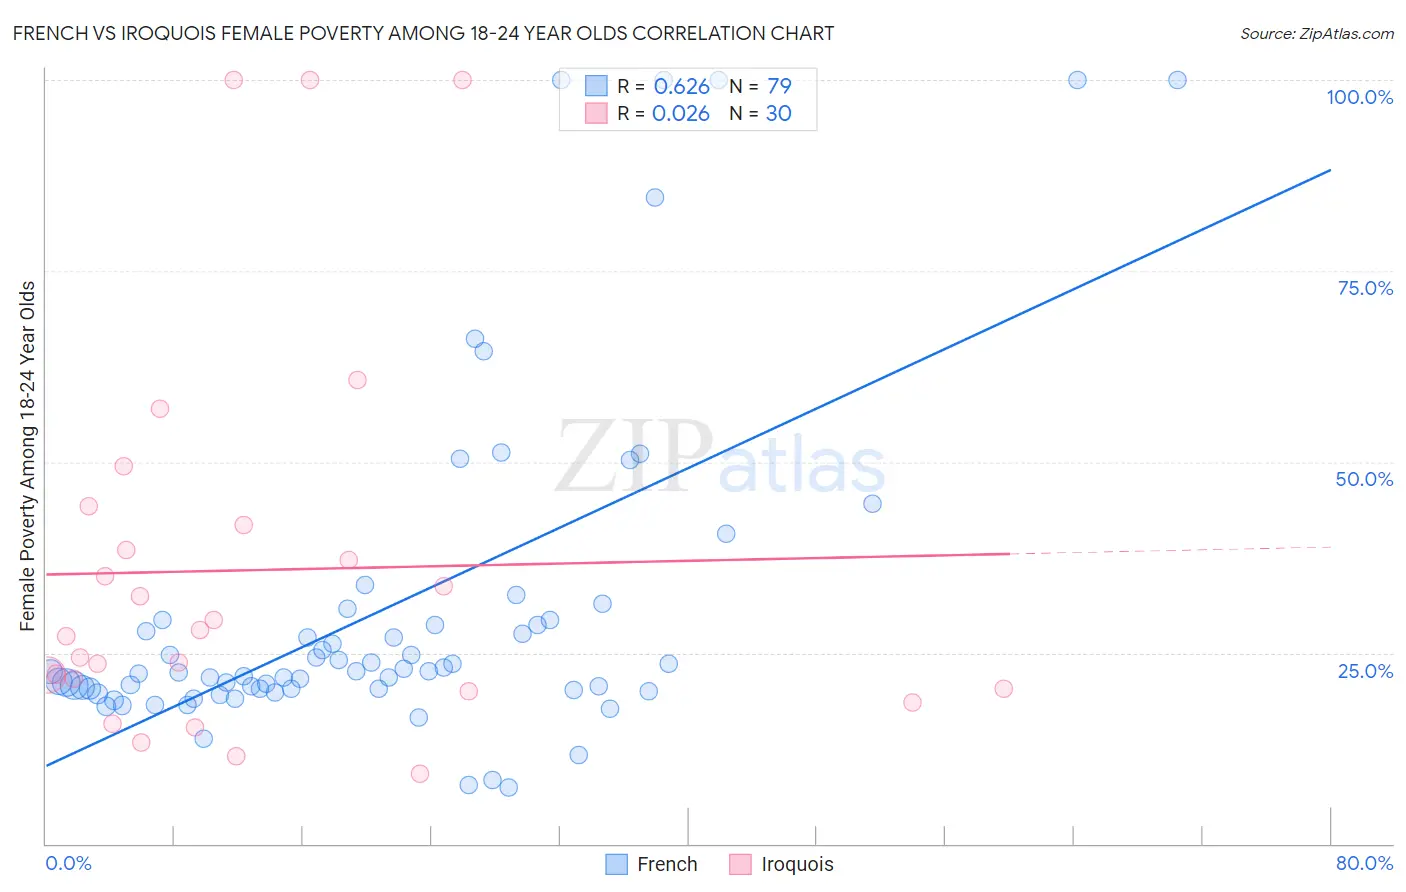
French vs Iroquois Female Poverty Among 18-24 Year Olds Correlation Chart
The statistical analysis conducted on geographies consisting of 537,643,962 people shows a significant positive correlation between the proportion of French and poverty level among females between the ages 18 and 24 in the United States with a correlation coefficient (R) of 0.626 and weighted average of 20.7%. Similarly, the statistical analysis conducted on geographies consisting of 204,291,578 people shows no correlation between the proportion of Iroquois and poverty level among females between the ages 18 and 24 in the United States with a correlation coefficient (R) of 0.026 and weighted average of 22.9%, a difference of 10.8%.
Female Poverty Among 18-24 Year Olds Correlation Summary
| Measurement | French | Iroquois |
| Minimum | 7.4% | 9.2% |
| Maximum | 100.0% | 100.0% |
| Range | 92.6% | 90.8% |
| Mean | 30.7% | 35.8% |
| Median | 22.6% | 27.6% |
| Interquartile 25% (IQ1) | 20.3% | 20.3% |
| Interquartile 75% (IQ3) | 29.3% | 41.7% |
| Interquartile Range (IQR) | 8.9% | 21.4% |
| Standard Deviation (Sample) | 22.1% | 25.2% |
| Standard Deviation (Population) | 21.9% | 24.7% |
Similar Demographics by Female Poverty Among 18-24 Year Olds
Demographics Similar to French by Female Poverty Among 18-24 Year Olds
In terms of female poverty among 18-24 year olds, the demographic groups most similar to French are Guatemalan (20.7%, a difference of 0.030%), Immigrants from Liberia (20.7%, a difference of 0.040%), Norwegian (20.7%, a difference of 0.11%), Estonian (20.7%, a difference of 0.13%), and Barbadian (20.7%, a difference of 0.16%).
| Demographics | Rating | Rank | Female Poverty Among 18-24 Year Olds |
| Immigrants | Western Africa | 10.2 /100 | #216 | Poor 20.6% |
| Immigrants | Laos | 9.7 /100 | #217 | Tragic 20.6% |
| Immigrants | Nepal | 9.6 /100 | #218 | Tragic 20.7% |
| Immigrants | Micronesia | 9.6 /100 | #219 | Tragic 20.7% |
| British | 9.4 /100 | #220 | Tragic 20.7% |
| Barbadians | 9.0 /100 | #221 | Tragic 20.7% |
| Guatemalans | 8.1 /100 | #222 | Tragic 20.7% |
| French | 7.9 /100 | #223 | Tragic 20.7% |
| Immigrants | Liberia | 7.6 /100 | #224 | Tragic 20.7% |
| Norwegians | 7.3 /100 | #225 | Tragic 20.7% |
| Estonians | 7.2 /100 | #226 | Tragic 20.7% |
| Immigrants | Sweden | 6.8 /100 | #227 | Tragic 20.7% |
| Ghanaians | 6.5 /100 | #228 | Tragic 20.8% |
| Australians | 6.1 /100 | #229 | Tragic 20.8% |
| Whites/Caucasians | 6.1 /100 | #230 | Tragic 20.8% |
Demographics Similar to Iroquois by Female Poverty Among 18-24 Year Olds
In terms of female poverty among 18-24 year olds, the demographic groups most similar to Iroquois are Senegalese (23.0%, a difference of 0.15%), Sudanese (23.0%, a difference of 0.30%), Immigrants from Kuwait (23.0%, a difference of 0.35%), Seminole (22.9%, a difference of 0.39%), and African (22.8%, a difference of 0.48%).
| Demographics | Rating | Rank | Female Poverty Among 18-24 Year Olds |
| Shoshone | 0.0 /100 | #295 | Tragic 22.5% |
| Menominee | 0.0 /100 | #296 | Tragic 22.5% |
| Inupiat | 0.0 /100 | #297 | Tragic 22.6% |
| Central American Indians | 0.0 /100 | #298 | Tragic 22.6% |
| Cherokee | 0.0 /100 | #299 | Tragic 22.7% |
| Africans | 0.0 /100 | #300 | Tragic 22.8% |
| Seminole | 0.0 /100 | #301 | Tragic 22.9% |
| Iroquois | 0.0 /100 | #302 | Tragic 22.9% |
| Senegalese | 0.0 /100 | #303 | Tragic 23.0% |
| Sudanese | 0.0 /100 | #304 | Tragic 23.0% |
| Immigrants | Kuwait | 0.0 /100 | #305 | Tragic 23.0% |
| Paiute | 0.0 /100 | #306 | Tragic 23.3% |
| Cree | 0.0 /100 | #307 | Tragic 23.4% |
| Immigrants | Sudan | 0.0 /100 | #308 | Tragic 23.5% |
| Blackfeet | 0.0 /100 | #309 | Tragic 23.6% |