European vs Arapaho 6th Grade
COMPARE
European
Arapaho
6th Grade
6th Grade Comparison
Europeans
Arapaho
98.0%
6TH GRADE
100.0/ 100
METRIC RATING
31st/ 347
METRIC RANK
97.8%
6TH GRADE
99.9/ 100
METRIC RATING
46th/ 347
METRIC RANK
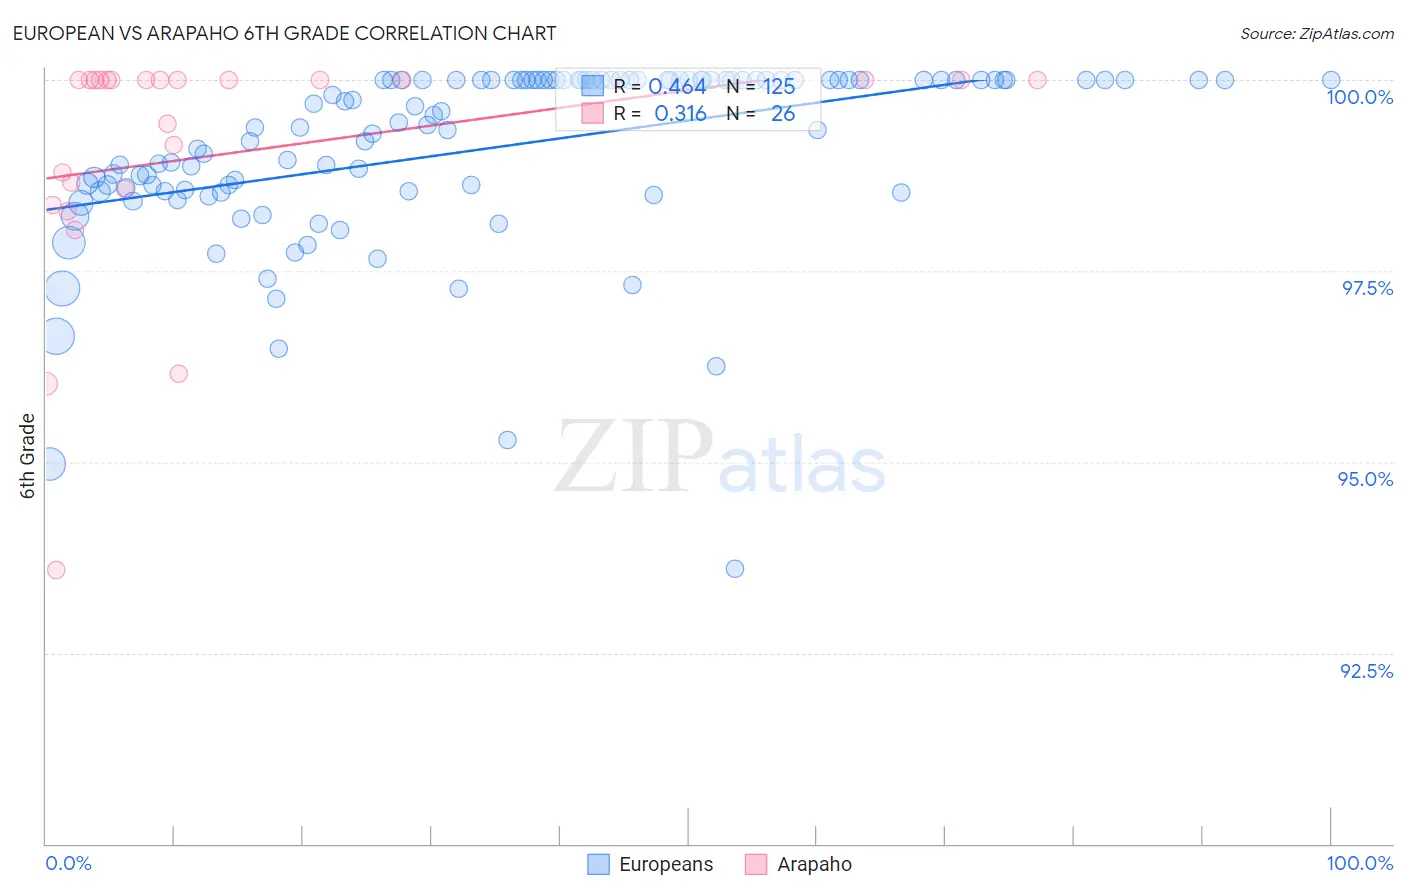
European vs Arapaho 6th Grade Correlation Chart
The statistical analysis conducted on geographies consisting of 561,829,544 people shows a moderate positive correlation between the proportion of Europeans and percentage of population with at least 6th grade education in the United States with a correlation coefficient (R) of 0.464 and weighted average of 98.0%. Similarly, the statistical analysis conducted on geographies consisting of 29,780,295 people shows a mild positive correlation between the proportion of Arapaho and percentage of population with at least 6th grade education in the United States with a correlation coefficient (R) of 0.316 and weighted average of 97.8%, a difference of 0.22%.
6th Grade Correlation Summary
| Measurement | European | Arapaho |
| Minimum | 93.6% | 93.6% |
| Maximum | 100.0% | 100.0% |
| Range | 6.4% | 6.4% |
| Mean | 99.1% | 99.0% |
| Median | 99.5% | 100.0% |
| Interquartile 25% (IQ1) | 98.5% | 98.6% |
| Interquartile 75% (IQ3) | 100.0% | 100.0% |
| Interquartile Range (IQR) | 1.5% | 1.4% |
| Standard Deviation (Sample) | 1.2% | 1.6% |
| Standard Deviation (Population) | 1.2% | 1.6% |
Demographics Similar to Europeans and Arapaho by 6th Grade
In terms of 6th grade, the demographic groups most similar to Europeans are French Canadian (98.0%, a difference of 0.0%), Scandinavian (98.0%, a difference of 0.010%), French (98.0%, a difference of 0.010%), Alaska Native (98.0%, a difference of 0.010%), and Chippewa (97.9%, a difference of 0.040%). Similarly, the demographic groups most similar to Arapaho are Bulgarian (97.8%, a difference of 0.010%), Native Hawaiian (97.8%, a difference of 0.010%), Celtic (97.8%, a difference of 0.010%), Czechoslovakian (97.8%, a difference of 0.030%), and Northern European (97.8%, a difference of 0.050%).
| Demographics | Rating | Rank | 6th Grade |
| Scandinavians | 100.0 /100 | #28 | Exceptional 98.0% |
| French | 100.0 /100 | #29 | Exceptional 98.0% |
| French Canadians | 100.0 /100 | #30 | Exceptional 98.0% |
| Europeans | 100.0 /100 | #31 | Exceptional 98.0% |
| Alaska Natives | 100.0 /100 | #32 | Exceptional 98.0% |
| Chippewa | 100.0 /100 | #33 | Exceptional 97.9% |
| Swiss | 100.0 /100 | #34 | Exceptional 97.9% |
| Chinese | 100.0 /100 | #35 | Exceptional 97.9% |
| Italians | 100.0 /100 | #36 | Exceptional 97.9% |
| British | 100.0 /100 | #37 | Exceptional 97.9% |
| Belgians | 100.0 /100 | #38 | Exceptional 97.9% |
| Luxembourgers | 99.9 /100 | #39 | Exceptional 97.9% |
| Latvians | 99.9 /100 | #40 | Exceptional 97.9% |
| Eastern Europeans | 99.9 /100 | #41 | Exceptional 97.9% |
| Hungarians | 99.9 /100 | #42 | Exceptional 97.8% |
| Northern Europeans | 99.9 /100 | #43 | Exceptional 97.8% |
| Czechoslovakians | 99.9 /100 | #44 | Exceptional 97.8% |
| Bulgarians | 99.9 /100 | #45 | Exceptional 97.8% |
| Arapaho | 99.9 /100 | #46 | Exceptional 97.8% |
| Native Hawaiians | 99.9 /100 | #47 | Exceptional 97.8% |
| Celtics | 99.9 /100 | #48 | Exceptional 97.8% |