Macedonian vs Assyrian/Chaldean/Syriac Householder Income Under 25 years
COMPARE
Macedonian
Assyrian/Chaldean/Syriac
Householder Income Under 25 years
Householder Income Under 25 years Comparison
Macedonians
Assyrians/Chaldeans/Syriacs
$54,563
HOUSEHOLDER INCOME UNDER 25 YEARS
99.7/ 100
METRIC RATING
73rd/ 347
METRIC RANK
$65,329
HOUSEHOLDER INCOME UNDER 25 YEARS
100.0/ 100
METRIC RATING
1st/ 347
METRIC RANK
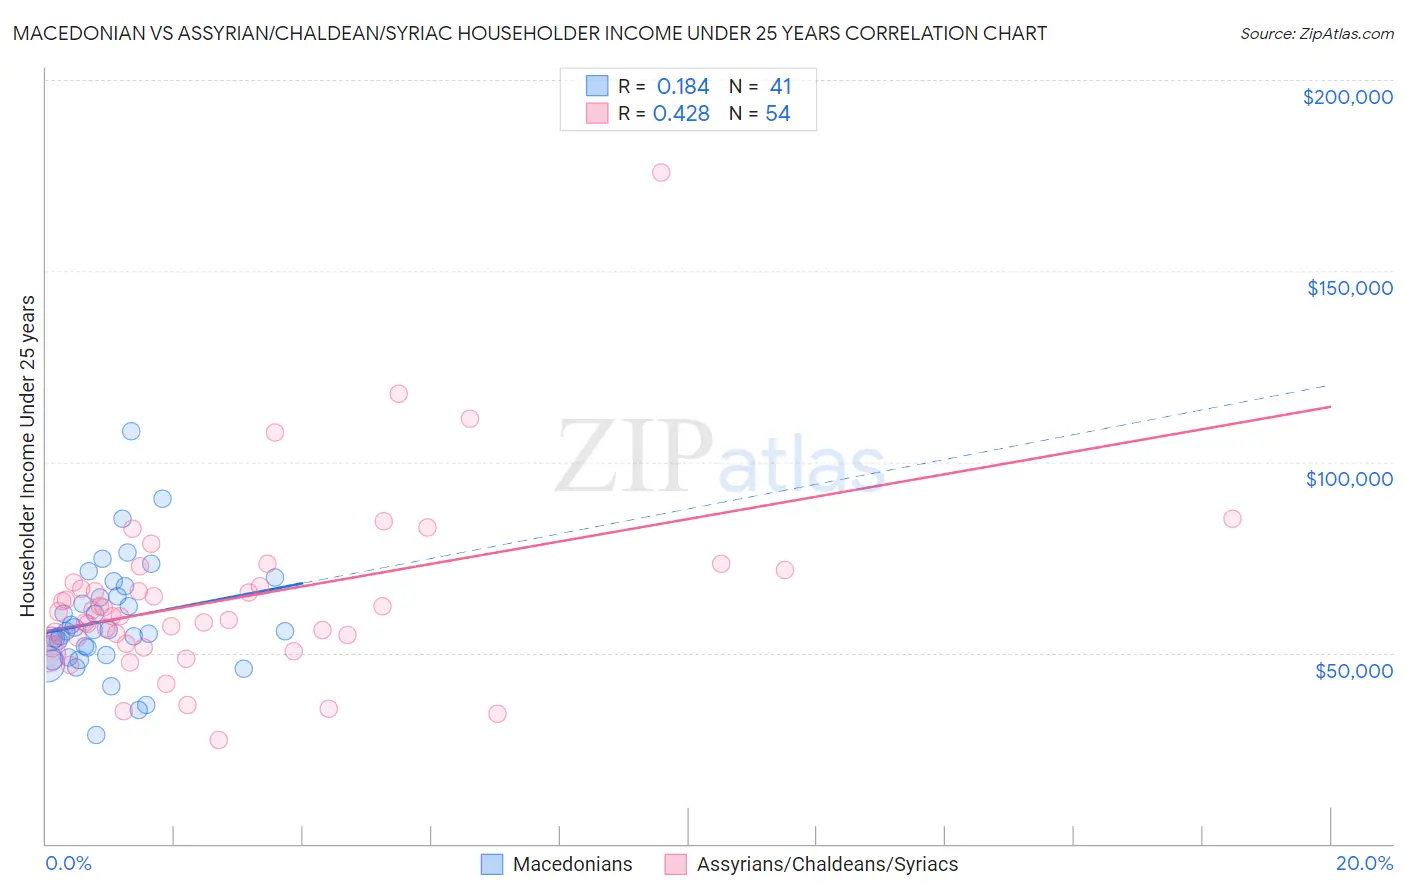
Macedonian vs Assyrian/Chaldean/Syriac Householder Income Under 25 years Correlation Chart
The statistical analysis conducted on geographies consisting of 119,675,236 people shows a poor positive correlation between the proportion of Macedonians and household income with householder under the age of 25 in the United States with a correlation coefficient (R) of 0.184 and weighted average of $54,563. Similarly, the statistical analysis conducted on geographies consisting of 100,770,753 people shows a moderate positive correlation between the proportion of Assyrians/Chaldeans/Syriacs and household income with householder under the age of 25 in the United States with a correlation coefficient (R) of 0.428 and weighted average of $65,329, a difference of 19.7%.
Householder Income Under 25 years Correlation Summary
| Measurement | Macedonian | Assyrian/Chaldean/Syriac |
| Minimum | $28,544 | $27,045 |
| Maximum | $108,182 | $175,865 |
| Range | $79,638 | $148,820 |
| Mean | $58,519 | $64,201 |
| Median | $55,634 | $60,126 |
| Interquartile 25% (IQ1) | $49,194 | $52,453 |
| Interquartile 75% (IQ3) | $66,027 | $68,319 |
| Interquartile Range (IQR) | $16,833 | $15,866 |
| Standard Deviation (Sample) | $14,918 | $23,487 |
| Standard Deviation (Population) | $14,735 | $23,269 |
Similar Demographics by Householder Income Under 25 years
Demographics Similar to Macedonians by Householder Income Under 25 years
In terms of householder income under 25 years, the demographic groups most similar to Macedonians are Immigrants from Northern Europe ($54,571, a difference of 0.020%), Immigrants from Grenada ($54,538, a difference of 0.050%), Immigrants from Morocco ($54,593, a difference of 0.060%), Immigrants from El Salvador ($54,599, a difference of 0.070%), and Samoan ($54,610, a difference of 0.090%).
| Demographics | Rating | Rank | Householder Income Under 25 years |
| Immigrants | Bangladesh | 99.8 /100 | #66 | Exceptional $54,714 |
| Okinawans | 99.8 /100 | #67 | Exceptional $54,701 |
| Tsimshian | 99.8 /100 | #68 | Exceptional $54,649 |
| Samoans | 99.7 /100 | #69 | Exceptional $54,610 |
| Immigrants | El Salvador | 99.7 /100 | #70 | Exceptional $54,599 |
| Immigrants | Morocco | 99.7 /100 | #71 | Exceptional $54,593 |
| Immigrants | Northern Europe | 99.7 /100 | #72 | Exceptional $54,571 |
| Macedonians | 99.7 /100 | #73 | Exceptional $54,563 |
| Immigrants | Grenada | 99.7 /100 | #74 | Exceptional $54,538 |
| Immigrants | Sri Lanka | 99.7 /100 | #75 | Exceptional $54,512 |
| Immigrants | Brazil | 99.6 /100 | #76 | Exceptional $54,487 |
| Immigrants | Southern Europe | 99.6 /100 | #77 | Exceptional $54,484 |
| Nepalese | 99.6 /100 | #78 | Exceptional $54,472 |
| Immigrants | Italy | 99.6 /100 | #79 | Exceptional $54,449 |
| Egyptians | 99.6 /100 | #80 | Exceptional $54,444 |
Demographics Similar to Assyrians/Chaldeans/Syriacs by Householder Income Under 25 years
In terms of householder income under 25 years, the demographic groups most similar to Assyrians/Chaldeans/Syriacs are Immigrants from Hong Kong ($62,083, a difference of 5.2%), Immigrants from India ($59,914, a difference of 9.0%), Immigrants from Taiwan ($59,424, a difference of 9.9%), Immigrants from Bolivia ($59,389, a difference of 10.0%), and Thai ($59,187, a difference of 10.4%).
| Demographics | Rating | Rank | Householder Income Under 25 years |
| Assyrians/Chaldeans/Syriacs | 100.0 /100 | #1 | Exceptional $65,329 |
| Immigrants | Hong Kong | 100.0 /100 | #2 | Exceptional $62,083 |
| Immigrants | India | 100.0 /100 | #3 | Exceptional $59,914 |
| Immigrants | Taiwan | 100.0 /100 | #4 | Exceptional $59,424 |
| Immigrants | Bolivia | 100.0 /100 | #5 | Exceptional $59,389 |
| Thais | 100.0 /100 | #6 | Exceptional $59,187 |
| Bolivians | 100.0 /100 | #7 | Exceptional $58,506 |
| Indians (Asian) | 100.0 /100 | #8 | Exceptional $58,239 |
| Chinese | 100.0 /100 | #9 | Exceptional $58,162 |
| Afghans | 100.0 /100 | #10 | Exceptional $58,019 |
| Immigrants | China | 100.0 /100 | #11 | Exceptional $57,931 |
| Immigrants | Philippines | 100.0 /100 | #12 | Exceptional $57,930 |
| Immigrants | South Central Asia | 100.0 /100 | #13 | Exceptional $57,818 |
| Filipinos | 100.0 /100 | #14 | Exceptional $57,740 |
| Koreans | 100.0 /100 | #15 | Exceptional $57,730 |