European vs Immigrants from St. Vincent and the Grenadines Median Male Earnings
COMPARE
European
Immigrants from St. Vincent and the Grenadines
Median Male Earnings
Median Male Earnings Comparison
Europeans
Immigrants from St. Vincent and the Grenadines
$57,637
MEDIAN MALE EARNINGS
95.6/ 100
METRIC RATING
111th/ 347
METRIC RANK
$50,665
MEDIAN MALE EARNINGS
2.3/ 100
METRIC RATING
241st/ 347
METRIC RANK
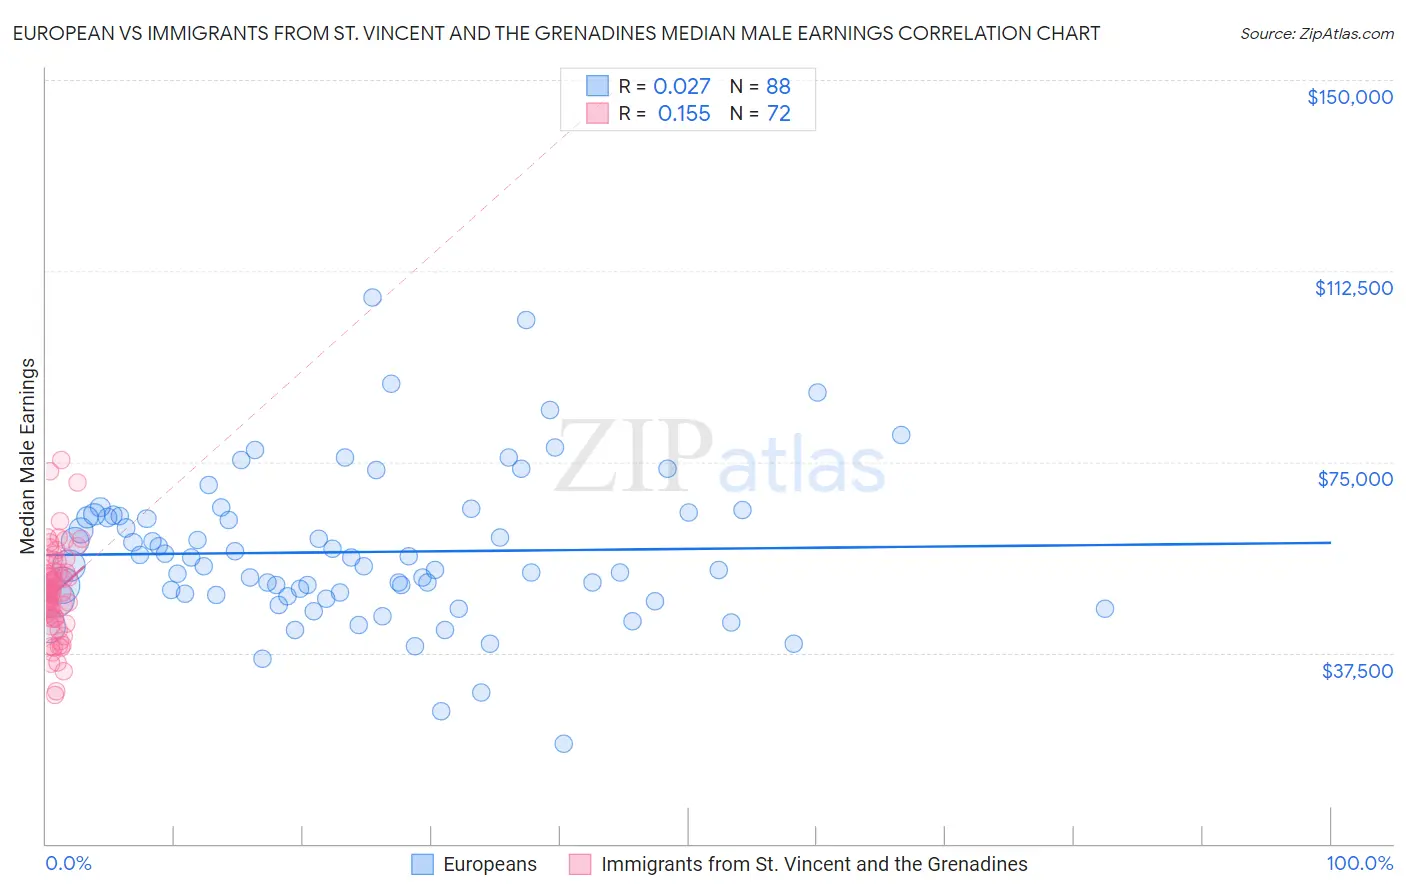
European vs Immigrants from St. Vincent and the Grenadines Median Male Earnings Correlation Chart
The statistical analysis conducted on geographies consisting of 560,846,229 people shows no correlation between the proportion of Europeans and median male earnings in the United States with a correlation coefficient (R) of 0.027 and weighted average of $57,637. Similarly, the statistical analysis conducted on geographies consisting of 56,194,300 people shows a poor positive correlation between the proportion of Immigrants from St. Vincent and the Grenadines and median male earnings in the United States with a correlation coefficient (R) of 0.155 and weighted average of $50,665, a difference of 13.8%.
Median Male Earnings Correlation Summary
| Measurement | European | Immigrants from St. Vincent and the Grenadines |
| Minimum | $19,583 | $29,197 |
| Maximum | $107,377 | $75,304 |
| Range | $87,794 | $46,107 |
| Mean | $57,294 | $49,395 |
| Median | $54,588 | $49,325 |
| Interquartile 25% (IQ1) | $48,703 | $44,224 |
| Interquartile 75% (IQ3) | $64,440 | $53,330 |
| Interquartile Range (IQR) | $15,737 | $9,107 |
| Standard Deviation (Sample) | $14,840 | $8,903 |
| Standard Deviation (Population) | $14,755 | $8,841 |
Similar Demographics by Median Male Earnings
Demographics Similar to Europeans by Median Male Earnings
In terms of median male earnings, the demographic groups most similar to Europeans are Immigrants from Afghanistan ($57,582, a difference of 0.090%), Carpatho Rusyn ($57,572, a difference of 0.11%), Immigrants from Kuwait ($57,562, a difference of 0.13%), Palestinian ($57,778, a difference of 0.25%), and Swedish ($57,445, a difference of 0.33%).
| Demographics | Rating | Rank | Median Male Earnings |
| Armenians | 97.3 /100 | #104 | Exceptional $58,134 |
| Immigrants | Western Asia | 97.3 /100 | #105 | Exceptional $58,131 |
| Immigrants | Northern Africa | 96.9 /100 | #106 | Exceptional $58,008 |
| Serbians | 96.8 /100 | #107 | Exceptional $57,975 |
| Immigrants | Uzbekistan | 96.7 /100 | #108 | Exceptional $57,941 |
| British | 96.5 /100 | #109 | Exceptional $57,890 |
| Palestinians | 96.2 /100 | #110 | Exceptional $57,778 |
| Europeans | 95.6 /100 | #111 | Exceptional $57,637 |
| Immigrants | Afghanistan | 95.4 /100 | #112 | Exceptional $57,582 |
| Carpatho Rusyns | 95.3 /100 | #113 | Exceptional $57,572 |
| Immigrants | Kuwait | 95.3 /100 | #114 | Exceptional $57,562 |
| Swedes | 94.8 /100 | #115 | Exceptional $57,445 |
| Lebanese | 94.6 /100 | #116 | Exceptional $57,409 |
| Immigrants | Zimbabwe | 94.3 /100 | #117 | Exceptional $57,352 |
| Hungarians | 94.0 /100 | #118 | Exceptional $57,309 |
Demographics Similar to Immigrants from St. Vincent and the Grenadines by Median Male Earnings
In terms of median male earnings, the demographic groups most similar to Immigrants from St. Vincent and the Grenadines are West Indian ($50,682, a difference of 0.030%), Guyanese ($50,613, a difference of 0.10%), French American Indian ($50,611, a difference of 0.11%), American ($50,761, a difference of 0.19%), and Malaysian ($50,772, a difference of 0.21%).
| Demographics | Rating | Rank | Median Male Earnings |
| Cape Verdeans | 3.5 /100 | #234 | Tragic $51,103 |
| Immigrants | Western Africa | 3.0 /100 | #235 | Tragic $50,940 |
| Pennsylvania Germans | 2.8 /100 | #236 | Tragic $50,878 |
| Immigrants | Barbados | 2.6 /100 | #237 | Tragic $50,795 |
| Malaysians | 2.5 /100 | #238 | Tragic $50,772 |
| Americans | 2.5 /100 | #239 | Tragic $50,761 |
| West Indians | 2.3 /100 | #240 | Tragic $50,682 |
| Immigrants | St. Vincent and the Grenadines | 2.3 /100 | #241 | Tragic $50,665 |
| Guyanese | 2.2 /100 | #242 | Tragic $50,613 |
| French American Indians | 2.2 /100 | #243 | Tragic $50,611 |
| Houma | 2.0 /100 | #244 | Tragic $50,547 |
| Hawaiians | 1.9 /100 | #245 | Tragic $50,488 |
| Immigrants | Ecuador | 1.9 /100 | #246 | Tragic $50,474 |
| Sub-Saharan Africans | 1.8 /100 | #247 | Tragic $50,408 |
| Immigrants | Guyana | 1.6 /100 | #248 | Tragic $50,321 |