Immigrants from Hong Kong vs Okinawan Per Capita Income
COMPARE
Immigrants from Hong Kong
Okinawan
Per Capita Income
Per Capita Income Comparison
Immigrants from Hong Kong
Okinawans
$56,709
PER CAPITA INCOME
100.0/ 100
METRIC RATING
8th/ 347
METRIC RANK
$55,817
PER CAPITA INCOME
100.0/ 100
METRIC RATING
10th/ 347
METRIC RANK
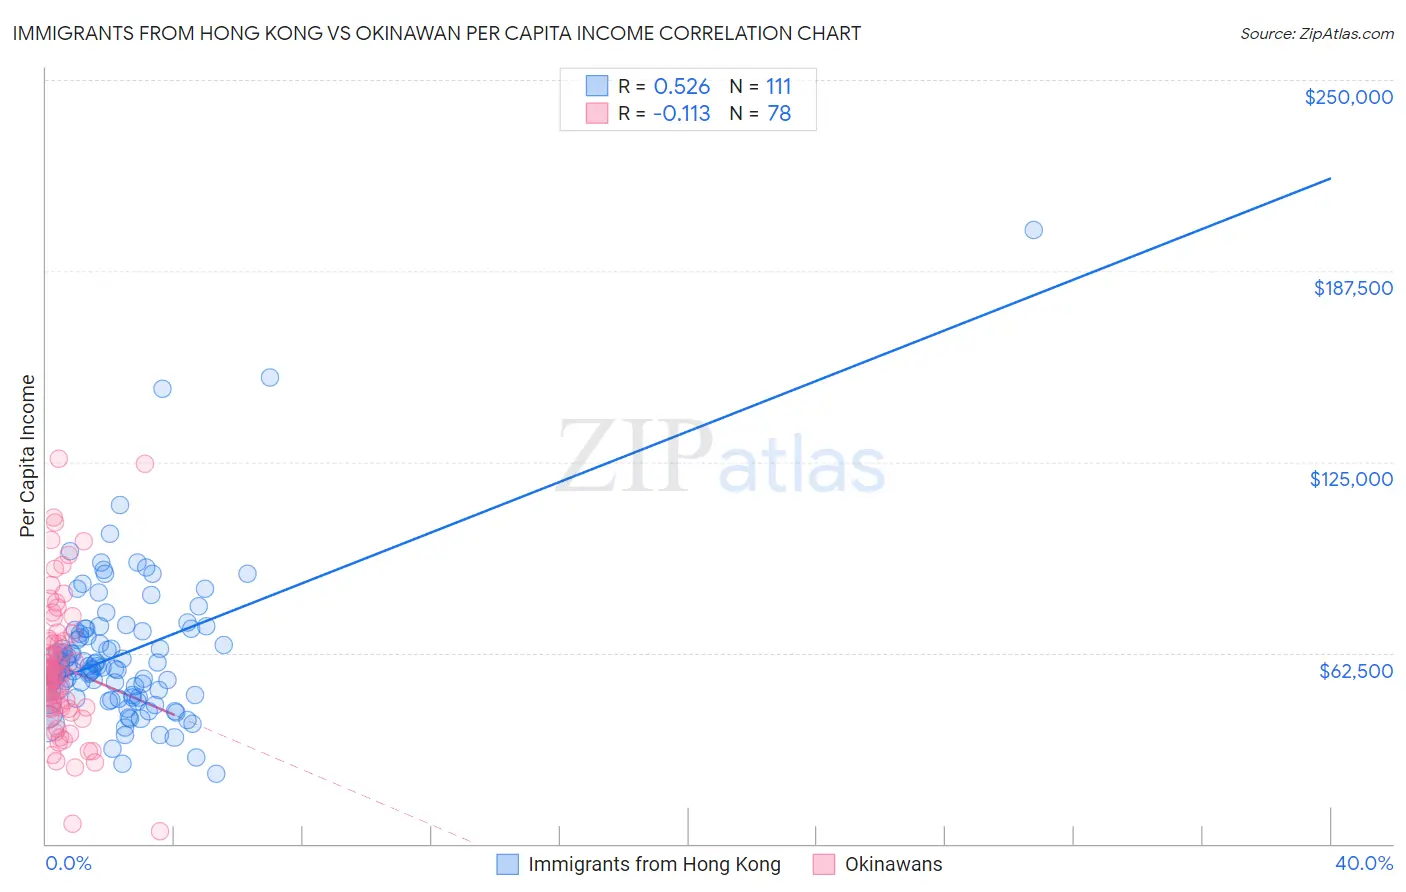
Immigrants from Hong Kong vs Okinawan Per Capita Income Correlation Chart
The statistical analysis conducted on geographies consisting of 253,979,312 people shows a substantial positive correlation between the proportion of Immigrants from Hong Kong and per capita income in the United States with a correlation coefficient (R) of 0.526 and weighted average of $56,709. Similarly, the statistical analysis conducted on geographies consisting of 73,745,153 people shows a poor negative correlation between the proportion of Okinawans and per capita income in the United States with a correlation coefficient (R) of -0.113 and weighted average of $55,817, a difference of 1.6%.
Per Capita Income Correlation Summary
| Measurement | Immigrants from Hong Kong | Okinawan |
| Minimum | $23,001 | $4,017 |
| Maximum | $200,879 | $126,204 |
| Range | $177,878 | $122,187 |
| Mean | $62,312 | $57,948 |
| Median | $57,767 | $55,509 |
| Interquartile 25% (IQ1) | $47,777 | $44,396 |
| Interquartile 75% (IQ3) | $69,849 | $66,910 |
| Interquartile Range (IQR) | $22,072 | $22,513 |
| Standard Deviation (Sample) | $24,374 | $23,213 |
| Standard Deviation (Population) | $24,264 | $23,064 |
Demographics Similar to Immigrants from Hong Kong and Okinawans by Per Capita Income
In terms of per capita income, the demographic groups most similar to Immigrants from Hong Kong are Immigrants from Ireland ($56,584, a difference of 0.22%), Immigrants from Israel ($57,384, a difference of 1.2%), Eastern European ($55,780, a difference of 1.7%), Immigrants from Taiwan ($57,742, a difference of 1.8%), and Immigrants from Iran ($57,759, a difference of 1.8%). Similarly, the demographic groups most similar to Okinawans are Eastern European ($55,780, a difference of 0.070%), Immigrants from Sweden ($55,582, a difference of 0.42%), Immigrants from India ($55,268, a difference of 0.99%), Immigrants from Belgium ($55,082, a difference of 1.3%), and Immigrants from Ireland ($56,584, a difference of 1.4%).
| Demographics | Rating | Rank | Per Capita Income |
| Filipinos | 100.0 /100 | #1 | Exceptional $59,066 |
| Iranians | 100.0 /100 | #2 | Exceptional $58,786 |
| Immigrants | Singapore | 100.0 /100 | #3 | Exceptional $58,353 |
| Immigrants | Australia | 100.0 /100 | #4 | Exceptional $57,953 |
| Immigrants | Iran | 100.0 /100 | #5 | Exceptional $57,759 |
| Immigrants | Taiwan | 100.0 /100 | #6 | Exceptional $57,742 |
| Immigrants | Israel | 100.0 /100 | #7 | Exceptional $57,384 |
| Immigrants | Hong Kong | 100.0 /100 | #8 | Exceptional $56,709 |
| Immigrants | Ireland | 100.0 /100 | #9 | Exceptional $56,584 |
| Okinawans | 100.0 /100 | #10 | Exceptional $55,817 |
| Eastern Europeans | 100.0 /100 | #11 | Exceptional $55,780 |
| Immigrants | Sweden | 100.0 /100 | #12 | Exceptional $55,582 |
| Immigrants | India | 100.0 /100 | #13 | Exceptional $55,268 |
| Immigrants | Belgium | 100.0 /100 | #14 | Exceptional $55,082 |
| Cypriots | 100.0 /100 | #15 | Exceptional $54,899 |
| Immigrants | Switzerland | 100.0 /100 | #16 | Exceptional $54,866 |
| Immigrants | France | 100.0 /100 | #17 | Exceptional $54,557 |
| Thais | 100.0 /100 | #18 | Exceptional $54,307 |
| Immigrants | China | 100.0 /100 | #19 | Exceptional $54,264 |
| Soviet Union | 100.0 /100 | #20 | Exceptional $54,202 |