Comanche vs Immigrants from Somalia Median Male Earnings
COMPARE
Comanche
Immigrants from Somalia
Median Male Earnings
Median Male Earnings Comparison
Comanche
Immigrants from Somalia
$48,202
MEDIAN MALE EARNINGS
0.2/ 100
METRIC RATING
280th/ 347
METRIC RANK
$48,439
MEDIAN MALE EARNINGS
0.3/ 100
METRIC RATING
275th/ 347
METRIC RANK
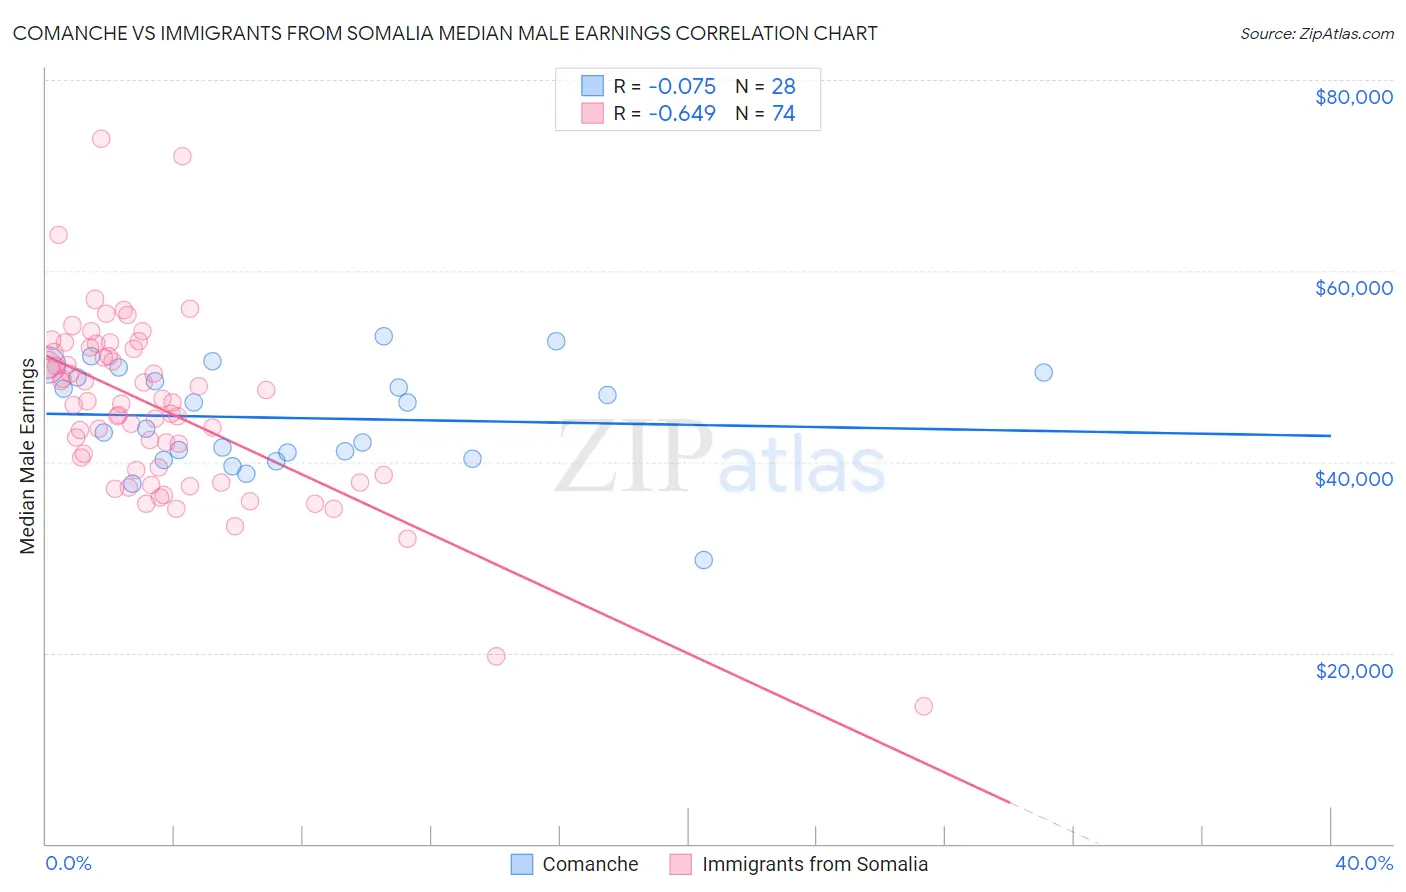
Comanche vs Immigrants from Somalia Median Male Earnings Correlation Chart
The statistical analysis conducted on geographies consisting of 109,761,350 people shows a slight negative correlation between the proportion of Comanche and median male earnings in the United States with a correlation coefficient (R) of -0.075 and weighted average of $48,202. Similarly, the statistical analysis conducted on geographies consisting of 92,109,982 people shows a significant negative correlation between the proportion of Immigrants from Somalia and median male earnings in the United States with a correlation coefficient (R) of -0.649 and weighted average of $48,439, a difference of 0.49%.
Median Male Earnings Correlation Summary
| Measurement | Comanche | Immigrants from Somalia |
| Minimum | $29,698 | $14,382 |
| Maximum | $53,182 | $73,796 |
| Range | $23,484 | $59,414 |
| Mean | $44,594 | $45,683 |
| Median | $44,855 | $46,151 |
| Interquartile 25% (IQ1) | $40,605 | $39,154 |
| Interquartile 75% (IQ3) | $49,111 | $51,463 |
| Interquartile Range (IQR) | $8,506 | $12,309 |
| Standard Deviation (Sample) | $5,459 | $9,409 |
| Standard Deviation (Population) | $5,361 | $9,346 |
Demographics Similar to Comanche and Immigrants from Somalia by Median Male Earnings
In terms of median male earnings, the demographic groups most similar to Comanche are Hmong ($48,254, a difference of 0.11%), Marshallese ($48,137, a difference of 0.13%), Central American ($48,093, a difference of 0.23%), Immigrants from Liberia ($48,317, a difference of 0.24%), and Belizean ($48,358, a difference of 0.32%). Similarly, the demographic groups most similar to Immigrants from Somalia are Blackfeet ($48,402, a difference of 0.080%), Colville ($48,516, a difference of 0.16%), Belizean ($48,358, a difference of 0.17%), Immigrants from Liberia ($48,317, a difference of 0.25%), and Hmong ($48,254, a difference of 0.38%).
| Demographics | Rating | Rank | Median Male Earnings |
| Spanish Americans | 0.5 /100 | #267 | Tragic $49,008 |
| Ute | 0.4 /100 | #268 | Tragic $48,899 |
| Tsimshian | 0.4 /100 | #269 | Tragic $48,836 |
| Potawatomi | 0.4 /100 | #270 | Tragic $48,768 |
| Cherokee | 0.3 /100 | #271 | Tragic $48,669 |
| Salvadorans | 0.3 /100 | #272 | Tragic $48,646 |
| Jamaicans | 0.3 /100 | #273 | Tragic $48,632 |
| Colville | 0.3 /100 | #274 | Tragic $48,516 |
| Immigrants | Somalia | 0.3 /100 | #275 | Tragic $48,439 |
| Blackfeet | 0.3 /100 | #276 | Tragic $48,402 |
| Belizeans | 0.2 /100 | #277 | Tragic $48,358 |
| Immigrants | Liberia | 0.2 /100 | #278 | Tragic $48,317 |
| Hmong | 0.2 /100 | #279 | Tragic $48,254 |
| Comanche | 0.2 /100 | #280 | Tragic $48,202 |
| Marshallese | 0.2 /100 | #281 | Tragic $48,137 |
| Central Americans | 0.2 /100 | #282 | Tragic $48,093 |
| Immigrants | Jamaica | 0.2 /100 | #283 | Tragic $48,040 |
| Africans | 0.2 /100 | #284 | Tragic $47,994 |
| Paiute | 0.2 /100 | #285 | Tragic $47,991 |
| Mexican American Indians | 0.2 /100 | #286 | Tragic $47,990 |
| Immigrants | El Salvador | 0.2 /100 | #287 | Tragic $47,973 |