Immigrants from Venezuela vs Immigrants from Norway Householder Income Ages 25 - 44 years
COMPARE
Immigrants from Venezuela
Immigrants from Norway
Householder Income Ages 25 - 44 years
Householder Income Ages 25 - 44 years Comparison
Immigrants from Venezuela
Immigrants from Norway
$87,038
HOUSEHOLDER INCOME AGES 25 - 44 YEARS
1.5/ 100
METRIC RATING
244th/ 347
METRIC RANK
$106,629
HOUSEHOLDER INCOME AGES 25 - 44 YEARS
99.9/ 100
METRIC RATING
53rd/ 347
METRIC RANK
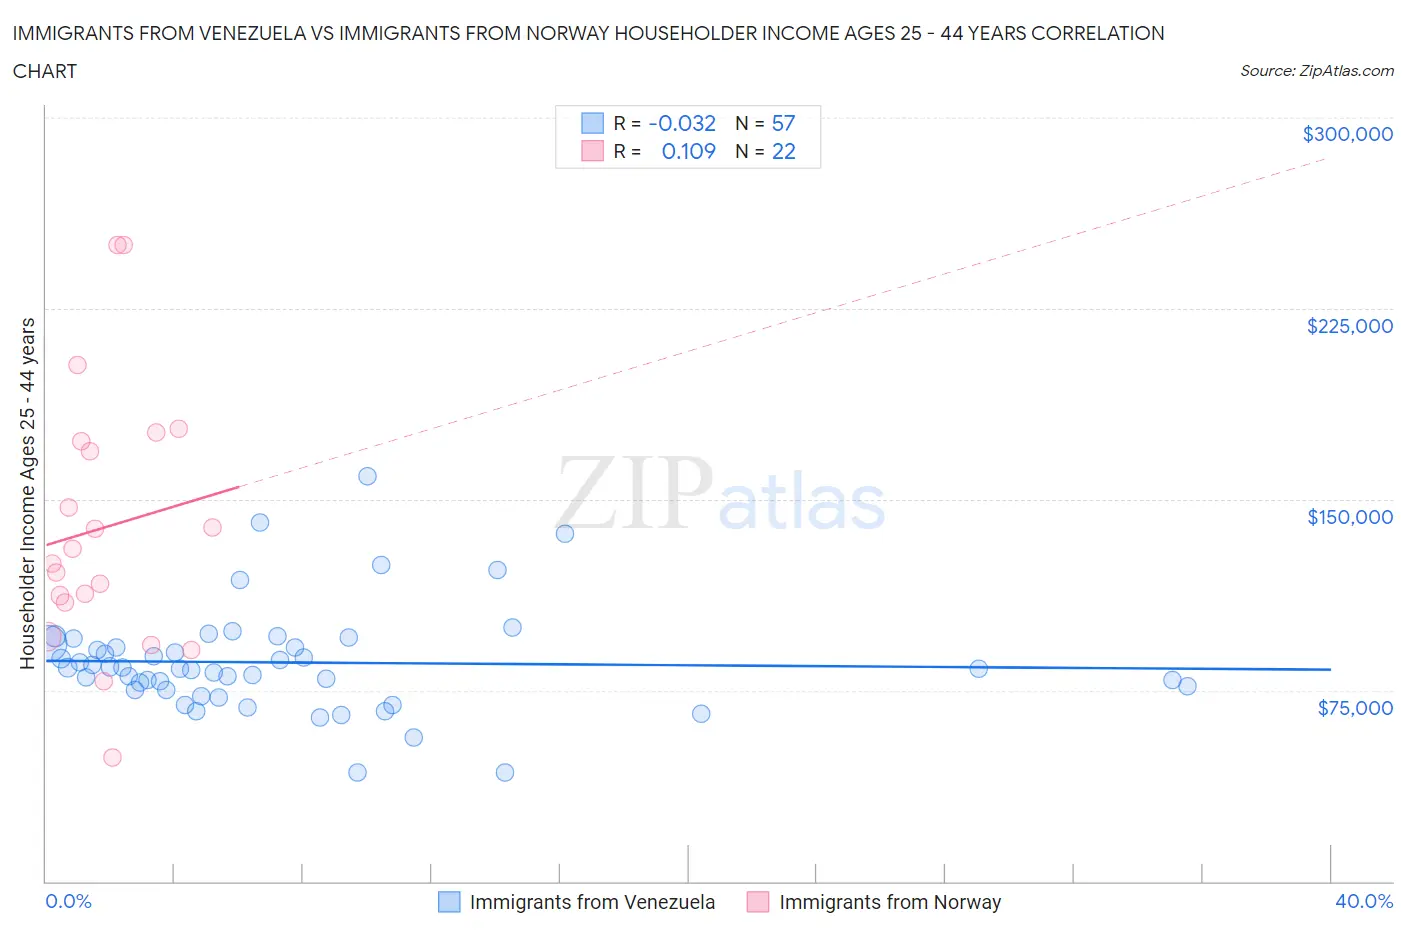
Immigrants from Venezuela vs Immigrants from Norway Householder Income Ages 25 - 44 years Correlation Chart
The statistical analysis conducted on geographies consisting of 287,593,793 people shows no correlation between the proportion of Immigrants from Venezuela and household income with householder between the ages 25 and 44 in the United States with a correlation coefficient (R) of -0.032 and weighted average of $87,038. Similarly, the statistical analysis conducted on geographies consisting of 116,548,648 people shows a poor positive correlation between the proportion of Immigrants from Norway and household income with householder between the ages 25 and 44 in the United States with a correlation coefficient (R) of 0.109 and weighted average of $106,629, a difference of 22.5%.
Householder Income Ages 25 - 44 years Correlation Summary
| Measurement | Immigrants from Venezuela | Immigrants from Norway |
| Minimum | $42,682 | $48,750 |
| Maximum | $159,302 | $250,001 |
| Range | $116,620 | $201,251 |
| Mean | $85,948 | $138,956 |
| Median | $83,506 | $127,644 |
| Interquartile 25% (IQ1) | $74,951 | $109,255 |
| Interquartile 75% (IQ3) | $92,632 | $172,615 |
| Interquartile Range (IQR) | $17,681 | $63,360 |
| Standard Deviation (Sample) | $20,900 | $51,236 |
| Standard Deviation (Population) | $20,716 | $50,058 |
Similar Demographics by Householder Income Ages 25 - 44 years
Demographics Similar to Immigrants from Venezuela by Householder Income Ages 25 - 44 years
In terms of householder income ages 25 - 44 years, the demographic groups most similar to Immigrants from Venezuela are Immigrants from West Indies ($87,063, a difference of 0.030%), Immigrants from El Salvador ($86,913, a difference of 0.14%), West Indian ($87,205, a difference of 0.19%), Immigrants from Burma/Myanmar ($86,736, a difference of 0.35%), and Immigrants from Nigeria ($86,589, a difference of 0.52%).
| Demographics | Rating | Rank | Householder Income Ages 25 - 44 years |
| Salvadorans | 2.8 /100 | #237 | Tragic $88,198 |
| Alaska Natives | 2.6 /100 | #238 | Tragic $88,018 |
| Immigrants | Ghana | 2.2 /100 | #239 | Tragic $87,760 |
| Nicaraguans | 2.2 /100 | #240 | Tragic $87,751 |
| Nigerians | 2.2 /100 | #241 | Tragic $87,730 |
| West Indians | 1.7 /100 | #242 | Tragic $87,205 |
| Immigrants | West Indies | 1.5 /100 | #243 | Tragic $87,063 |
| Immigrants | Venezuela | 1.5 /100 | #244 | Tragic $87,038 |
| Immigrants | El Salvador | 1.4 /100 | #245 | Tragic $86,913 |
| Immigrants | Burma/Myanmar | 1.3 /100 | #246 | Tragic $86,736 |
| Immigrants | Nigeria | 1.2 /100 | #247 | Tragic $86,589 |
| Immigrants | Sudan | 0.9 /100 | #248 | Tragic $86,109 |
| French American Indians | 0.8 /100 | #249 | Tragic $85,899 |
| Pennsylvania Germans | 0.8 /100 | #250 | Tragic $85,836 |
| Cape Verdeans | 0.8 /100 | #251 | Tragic $85,758 |
Demographics Similar to Immigrants from Norway by Householder Income Ages 25 - 44 years
In terms of householder income ages 25 - 44 years, the demographic groups most similar to Immigrants from Norway are Paraguayan ($106,615, a difference of 0.010%), Greek ($106,457, a difference of 0.16%), Immigrants from Europe ($106,817, a difference of 0.18%), Immigrants from Czechoslovakia ($106,888, a difference of 0.24%), and Immigrants from Pakistan ($106,129, a difference of 0.47%).
| Demographics | Rating | Rank | Householder Income Ages 25 - 44 years |
| Immigrants | Belarus | 99.9 /100 | #46 | Exceptional $107,393 |
| Estonians | 99.9 /100 | #47 | Exceptional $107,269 |
| Bulgarians | 99.9 /100 | #48 | Exceptional $107,264 |
| Immigrants | Turkey | 99.9 /100 | #49 | Exceptional $107,258 |
| Cambodians | 99.9 /100 | #50 | Exceptional $107,148 |
| Immigrants | Czechoslovakia | 99.9 /100 | #51 | Exceptional $106,888 |
| Immigrants | Europe | 99.9 /100 | #52 | Exceptional $106,817 |
| Immigrants | Norway | 99.9 /100 | #53 | Exceptional $106,629 |
| Paraguayans | 99.9 /100 | #54 | Exceptional $106,615 |
| Greeks | 99.9 /100 | #55 | Exceptional $106,457 |
| Immigrants | Pakistan | 99.8 /100 | #56 | Exceptional $106,129 |
| Immigrants | Austria | 99.8 /100 | #57 | Exceptional $106,103 |
| Immigrants | South Africa | 99.8 /100 | #58 | Exceptional $105,748 |
| Immigrants | Latvia | 99.8 /100 | #59 | Exceptional $105,522 |
| Egyptians | 99.7 /100 | #60 | Exceptional $105,282 |