Immigrants from Poland vs Immigrants from Guatemala Householder Income Over 65 years
COMPARE
Immigrants from Poland
Immigrants from Guatemala
Householder Income Over 65 years
Householder Income Over 65 years Comparison
Immigrants from Poland
Immigrants from Guatemala
$61,041
HOUSEHOLDER INCOME OVER 65 YEARS
51.9/ 100
METRIC RATING
172nd/ 347
METRIC RANK
$53,950
HOUSEHOLDER INCOME OVER 65 YEARS
0.1/ 100
METRIC RATING
284th/ 347
METRIC RANK
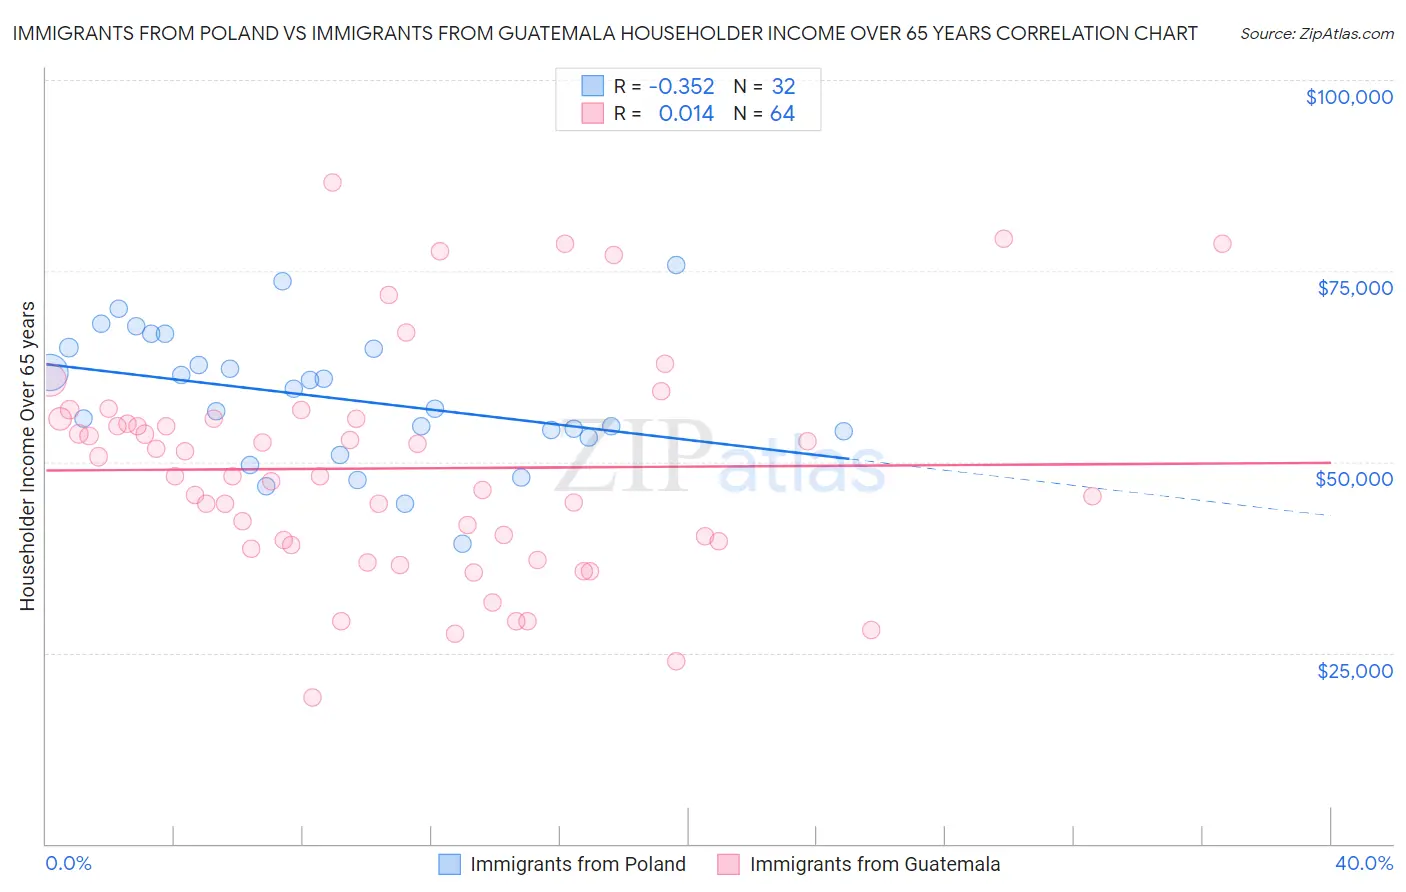
Immigrants from Poland vs Immigrants from Guatemala Householder Income Over 65 years Correlation Chart
The statistical analysis conducted on geographies consisting of 304,365,401 people shows a mild negative correlation between the proportion of Immigrants from Poland and household income with householder over the age of 65 in the United States with a correlation coefficient (R) of -0.352 and weighted average of $61,041. Similarly, the statistical analysis conducted on geographies consisting of 376,354,988 people shows no correlation between the proportion of Immigrants from Guatemala and household income with householder over the age of 65 in the United States with a correlation coefficient (R) of 0.014 and weighted average of $53,950, a difference of 13.1%.
Householder Income Over 65 years Correlation Summary
| Measurement | Immigrants from Poland | Immigrants from Guatemala |
| Minimum | $39,327 | $19,196 |
| Maximum | $75,833 | $86,499 |
| Range | $36,506 | $67,303 |
| Mean | $58,395 | $49,149 |
| Median | $58,314 | $48,160 |
| Interquartile 25% (IQ1) | $53,627 | $39,399 |
| Interquartile 75% (IQ3) | $64,869 | $55,646 |
| Interquartile Range (IQR) | $11,242 | $16,247 |
| Standard Deviation (Sample) | $8,628 | $14,455 |
| Standard Deviation (Population) | $8,492 | $14,342 |
Similar Demographics by Householder Income Over 65 years
Demographics Similar to Immigrants from Poland by Householder Income Over 65 years
In terms of householder income over 65 years, the demographic groups most similar to Immigrants from Poland are Inupiat ($61,061, a difference of 0.030%), Immigrants from Micronesia ($61,000, a difference of 0.070%), Serbian ($61,087, a difference of 0.080%), Irish ($61,097, a difference of 0.090%), and Carpatho Rusyn ($61,093, a difference of 0.090%).
| Demographics | Rating | Rank | Householder Income Over 65 years |
| Immigrants | Ukraine | 55.1 /100 | #165 | Average $61,163 |
| Immigrants | Eastern Africa | 55.0 /100 | #166 | Average $61,157 |
| Norwegians | 53.6 /100 | #167 | Average $61,104 |
| Irish | 53.4 /100 | #168 | Average $61,097 |
| Carpatho Rusyns | 53.3 /100 | #169 | Average $61,093 |
| Serbians | 53.1 /100 | #170 | Average $61,087 |
| Inupiat | 52.4 /100 | #171 | Average $61,061 |
| Immigrants | Poland | 51.9 /100 | #172 | Average $61,041 |
| Immigrants | Micronesia | 50.8 /100 | #173 | Average $61,000 |
| Luxembourgers | 50.0 /100 | #174 | Average $60,967 |
| Spaniards | 47.3 /100 | #175 | Average $60,866 |
| Spanish | 45.5 /100 | #176 | Average $60,795 |
| Alaska Natives | 44.3 /100 | #177 | Average $60,748 |
| Yup'ik | 43.7 /100 | #178 | Average $60,727 |
| Welsh | 42.2 /100 | #179 | Average $60,666 |
Demographics Similar to Immigrants from Guatemala by Householder Income Over 65 years
In terms of householder income over 65 years, the demographic groups most similar to Immigrants from Guatemala are Immigrants from Liberia ($53,967, a difference of 0.030%), Immigrants from Armenia ($53,974, a difference of 0.040%), Somali ($54,004, a difference of 0.10%), Mexican ($53,897, a difference of 0.10%), and Immigrants from Jamaica ($54,027, a difference of 0.14%).
| Demographics | Rating | Rank | Householder Income Over 65 years |
| Cheyenne | 0.1 /100 | #277 | Tragic $54,096 |
| Immigrants | Ecuador | 0.1 /100 | #278 | Tragic $54,030 |
| Blackfeet | 0.1 /100 | #279 | Tragic $54,029 |
| Immigrants | Jamaica | 0.1 /100 | #280 | Tragic $54,027 |
| Somalis | 0.1 /100 | #281 | Tragic $54,004 |
| Immigrants | Armenia | 0.1 /100 | #282 | Tragic $53,974 |
| Immigrants | Liberia | 0.1 /100 | #283 | Tragic $53,967 |
| Immigrants | Guatemala | 0.1 /100 | #284 | Tragic $53,950 |
| Mexicans | 0.1 /100 | #285 | Tragic $53,897 |
| Chippewa | 0.1 /100 | #286 | Tragic $53,847 |
| Immigrants | Barbados | 0.1 /100 | #287 | Tragic $53,766 |
| Paiute | 0.1 /100 | #288 | Tragic $53,762 |
| Iroquois | 0.1 /100 | #289 | Tragic $53,737 |
| Chickasaw | 0.1 /100 | #290 | Tragic $53,732 |
| Africans | 0.0 /100 | #291 | Tragic $53,711 |