Chinese vs Immigrants from Thailand Median Earnings
COMPARE
Chinese
Immigrants from Thailand
Median Earnings
Median Earnings Comparison
Chinese
Immigrants from Thailand
$48,836
MEDIAN EARNINGS
96.7/ 100
METRIC RATING
115th/ 347
METRIC RANK
$45,598
MEDIAN EARNINGS
23.7/ 100
METRIC RATING
209th/ 347
METRIC RANK
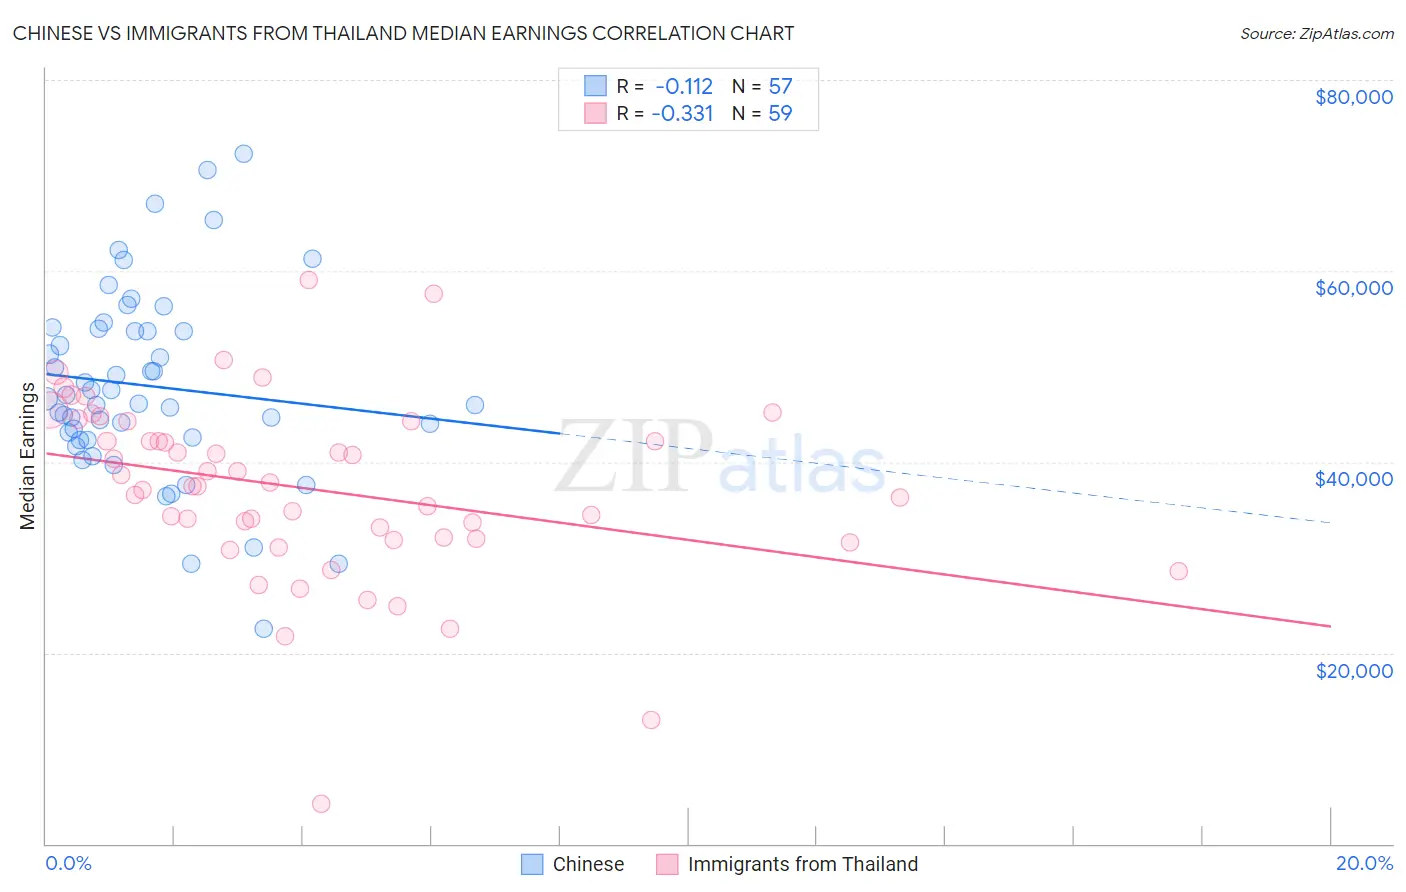
Chinese vs Immigrants from Thailand Median Earnings Correlation Chart
The statistical analysis conducted on geographies consisting of 64,808,012 people shows a poor negative correlation between the proportion of Chinese and median earnings in the United States with a correlation coefficient (R) of -0.112 and weighted average of $48,836. Similarly, the statistical analysis conducted on geographies consisting of 316,998,923 people shows a mild negative correlation between the proportion of Immigrants from Thailand and median earnings in the United States with a correlation coefficient (R) of -0.331 and weighted average of $45,598, a difference of 7.1%.
Median Earnings Correlation Summary
| Measurement | Chinese | Immigrants from Thailand |
| Minimum | $22,468 | $4,250 |
| Maximum | $72,308 | $59,094 |
| Range | $49,840 | $54,844 |
| Mean | $47,945 | $37,184 |
| Median | $46,556 | $37,501 |
| Interquartile 25% (IQ1) | $42,425 | $31,980 |
| Interquartile 75% (IQ3) | $53,869 | $44,250 |
| Interquartile Range (IQR) | $11,444 | $12,270 |
| Standard Deviation (Sample) | $9,906 | $9,579 |
| Standard Deviation (Population) | $9,819 | $9,498 |
Similar Demographics by Median Earnings
Demographics Similar to Chinese by Median Earnings
In terms of median earnings, the demographic groups most similar to Chinese are Moroccan ($48,838, a difference of 0.010%), Immigrants from Kuwait ($48,861, a difference of 0.050%), Northern European ($48,887, a difference of 0.10%), Immigrants from Zimbabwe ($48,913, a difference of 0.16%), and Immigrants from Ethiopia ($48,924, a difference of 0.18%).
| Demographics | Rating | Rank | Median Earnings |
| Palestinians | 98.0 /100 | #108 | Exceptional $49,209 |
| Syrians | 97.1 /100 | #109 | Exceptional $48,934 |
| Immigrants | Ethiopia | 97.1 /100 | #110 | Exceptional $48,924 |
| Immigrants | Zimbabwe | 97.0 /100 | #111 | Exceptional $48,913 |
| Northern Europeans | 96.9 /100 | #112 | Exceptional $48,887 |
| Immigrants | Kuwait | 96.8 /100 | #113 | Exceptional $48,861 |
| Moroccans | 96.7 /100 | #114 | Exceptional $48,838 |
| Chinese | 96.7 /100 | #115 | Exceptional $48,836 |
| Koreans | 96.2 /100 | #116 | Exceptional $48,727 |
| Serbians | 95.9 /100 | #117 | Exceptional $48,677 |
| Immigrants | Jordan | 95.9 /100 | #118 | Exceptional $48,673 |
| Poles | 95.8 /100 | #119 | Exceptional $48,659 |
| Carpatho Rusyns | 95.5 /100 | #120 | Exceptional $48,617 |
| Arabs | 95.4 /100 | #121 | Exceptional $48,599 |
| Chileans | 94.8 /100 | #122 | Exceptional $48,504 |
Demographics Similar to Immigrants from Thailand by Median Earnings
In terms of median earnings, the demographic groups most similar to Immigrants from Thailand are Immigrants from Bosnia and Herzegovina ($45,600, a difference of 0.0%), Immigrants from Grenada ($45,596, a difference of 0.0%), Panamanian ($45,593, a difference of 0.010%), Bermudan ($45,593, a difference of 0.010%), and Immigrants from Senegal ($45,611, a difference of 0.030%).
| Demographics | Rating | Rank | Median Earnings |
| Immigrants | Trinidad and Tobago | 27.1 /100 | #202 | Fair $45,729 |
| Welsh | 26.6 /100 | #203 | Fair $45,710 |
| Immigrants | Uruguay | 25.9 /100 | #204 | Fair $45,682 |
| Tongans | 25.4 /100 | #205 | Fair $45,665 |
| Immigrants | Ghana | 24.8 /100 | #206 | Fair $45,641 |
| Immigrants | Senegal | 24.0 /100 | #207 | Fair $45,611 |
| Immigrants | Bosnia and Herzegovina | 23.7 /100 | #208 | Fair $45,600 |
| Immigrants | Thailand | 23.7 /100 | #209 | Fair $45,598 |
| Immigrants | Grenada | 23.6 /100 | #210 | Fair $45,596 |
| Panamanians | 23.5 /100 | #211 | Fair $45,593 |
| Bermudans | 23.5 /100 | #212 | Fair $45,593 |
| Immigrants | Colombia | 22.4 /100 | #213 | Fair $45,550 |
| Nigerians | 22.0 /100 | #214 | Fair $45,532 |
| Immigrants | Bangladesh | 22.0 /100 | #215 | Fair $45,532 |
| Guyanese | 20.6 /100 | #216 | Fair $45,470 |