Cherokee vs Portuguese Householder Income Ages 25 - 44 years
COMPARE
Cherokee
Portuguese
Householder Income Ages 25 - 44 years
Householder Income Ages 25 - 44 years Comparison
Cherokee
Portuguese
$80,843
HOUSEHOLDER INCOME AGES 25 - 44 YEARS
0.0/ 100
METRIC RATING
300th/ 347
METRIC RANK
$99,429
HOUSEHOLDER INCOME AGES 25 - 44 YEARS
93.7/ 100
METRIC RATING
116th/ 347
METRIC RANK
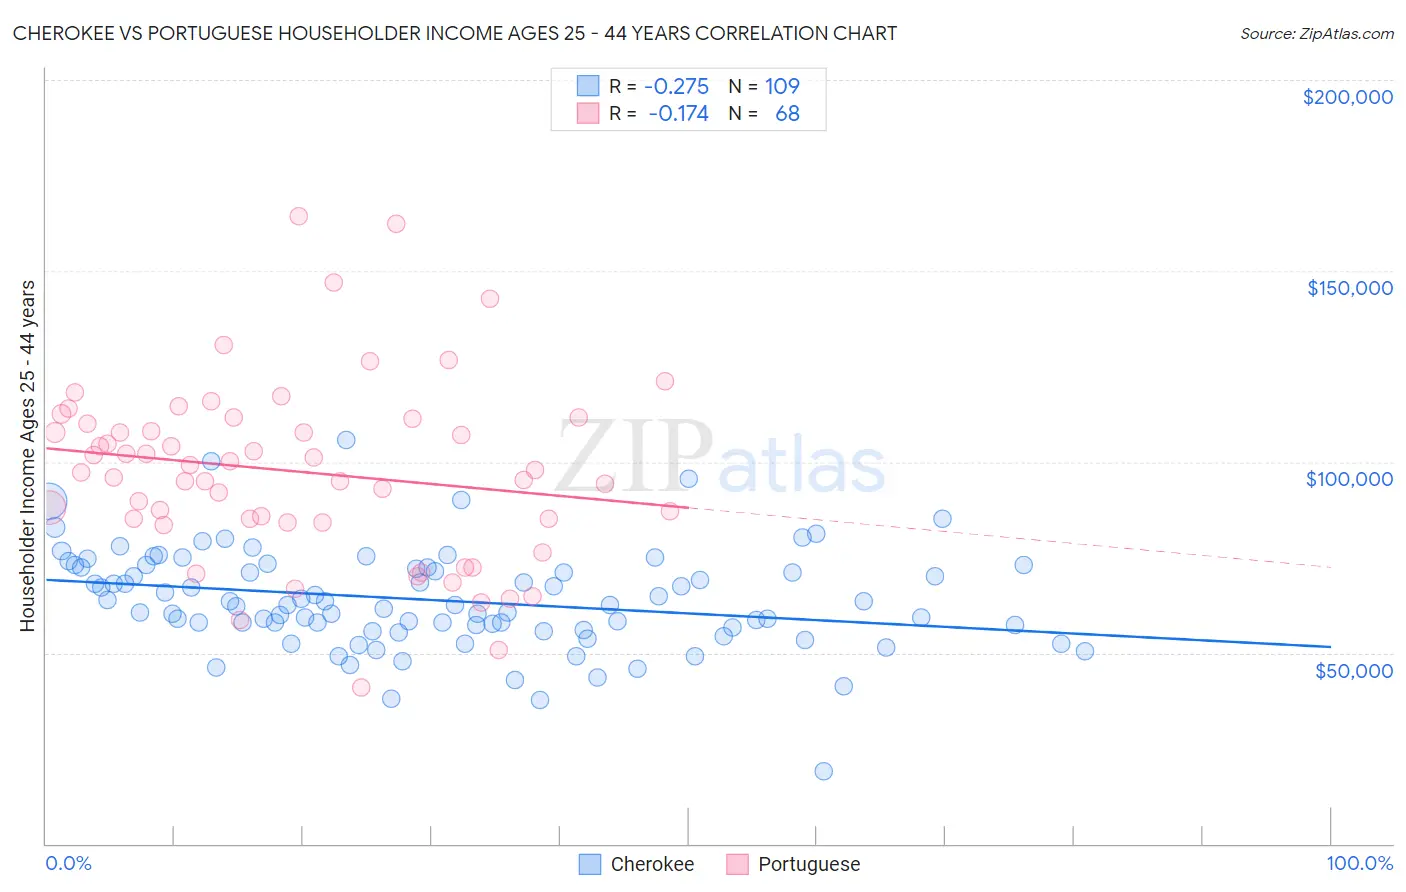
Cherokee vs Portuguese Householder Income Ages 25 - 44 years Correlation Chart
The statistical analysis conducted on geographies consisting of 490,925,760 people shows a weak negative correlation between the proportion of Cherokee and household income with householder between the ages 25 and 44 in the United States with a correlation coefficient (R) of -0.275 and weighted average of $80,843. Similarly, the statistical analysis conducted on geographies consisting of 448,408,954 people shows a poor negative correlation between the proportion of Portuguese and household income with householder between the ages 25 and 44 in the United States with a correlation coefficient (R) of -0.174 and weighted average of $99,429, a difference of 23.0%.
Householder Income Ages 25 - 44 years Correlation Summary
| Measurement | Cherokee | Portuguese |
| Minimum | $18,882 | $41,033 |
| Maximum | $105,572 | $164,238 |
| Range | $86,690 | $123,205 |
| Mean | $63,770 | $97,431 |
| Median | $62,500 | $97,526 |
| Interquartile 25% (IQ1) | $56,304 | $84,648 |
| Interquartile 75% (IQ3) | $72,426 | $110,670 |
| Interquartile Range (IQR) | $16,122 | $26,022 |
| Standard Deviation (Sample) | $13,175 | $23,647 |
| Standard Deviation (Population) | $13,114 | $23,472 |
Similar Demographics by Householder Income Ages 25 - 44 years
Demographics Similar to Cherokee by Householder Income Ages 25 - 44 years
In terms of householder income ages 25 - 44 years, the demographic groups most similar to Cherokee are Immigrants from Liberia ($80,863, a difference of 0.020%), Immigrants from Micronesia ($80,544, a difference of 0.37%), Hispanic or Latino ($80,515, a difference of 0.41%), Dominican ($81,229, a difference of 0.48%), and Mexican ($80,427, a difference of 0.52%).
| Demographics | Rating | Rank | Householder Income Ages 25 - 44 years |
| Blackfeet | 0.1 /100 | #293 | Tragic $81,531 |
| Cubans | 0.1 /100 | #294 | Tragic $81,483 |
| Bangladeshis | 0.1 /100 | #295 | Tragic $81,363 |
| Immigrants | Dominica | 0.1 /100 | #296 | Tragic $81,351 |
| Immigrants | Guatemala | 0.1 /100 | #297 | Tragic $81,341 |
| Dominicans | 0.1 /100 | #298 | Tragic $81,229 |
| Immigrants | Liberia | 0.1 /100 | #299 | Tragic $80,863 |
| Cherokee | 0.0 /100 | #300 | Tragic $80,843 |
| Immigrants | Micronesia | 0.0 /100 | #301 | Tragic $80,544 |
| Hispanics or Latinos | 0.0 /100 | #302 | Tragic $80,515 |
| Mexicans | 0.0 /100 | #303 | Tragic $80,427 |
| Immigrants | Caribbean | 0.0 /100 | #304 | Tragic $80,326 |
| Immigrants | Dominican Republic | 0.0 /100 | #305 | Tragic $80,319 |
| Apache | 0.0 /100 | #306 | Tragic $80,260 |
| Haitians | 0.0 /100 | #307 | Tragic $80,055 |
Demographics Similar to Portuguese by Householder Income Ages 25 - 44 years
In terms of householder income ages 25 - 44 years, the demographic groups most similar to Portuguese are Carpatho Rusyn ($99,449, a difference of 0.020%), Immigrants from Western Asia ($99,516, a difference of 0.090%), Tongan ($99,604, a difference of 0.18%), Immigrants from Northern Africa ($99,232, a difference of 0.20%), and Syrian ($99,215, a difference of 0.22%).
| Demographics | Rating | Rank | Householder Income Ages 25 - 44 years |
| Immigrants | North Macedonia | 95.6 /100 | #109 | Exceptional $100,101 |
| Immigrants | Afghanistan | 95.3 /100 | #110 | Exceptional $99,977 |
| Chileans | 95.1 /100 | #111 | Exceptional $99,900 |
| Poles | 94.5 /100 | #112 | Exceptional $99,685 |
| Tongans | 94.2 /100 | #113 | Exceptional $99,604 |
| Immigrants | Western Asia | 94.0 /100 | #114 | Exceptional $99,516 |
| Carpatho Rusyns | 93.7 /100 | #115 | Exceptional $99,449 |
| Portuguese | 93.7 /100 | #116 | Exceptional $99,429 |
| Immigrants | Northern Africa | 93.0 /100 | #117 | Exceptional $99,232 |
| Syrians | 92.9 /100 | #118 | Exceptional $99,215 |
| Jordanians | 92.8 /100 | #119 | Exceptional $99,186 |
| Swedes | 92.7 /100 | #120 | Exceptional $99,136 |
| Peruvians | 91.7 /100 | #121 | Exceptional $98,886 |
| Immigrants | Uzbekistan | 91.5 /100 | #122 | Exceptional $98,849 |
| Palestinians | 91.2 /100 | #123 | Exceptional $98,777 |