Immigrants from Somalia vs Jamaican Median Family Income
COMPARE
Immigrants from Somalia
Jamaican
Median Family Income
Median Family Income Comparison
Immigrants from Somalia
Jamaicans
$92,609
MEDIAN FAMILY INCOME
0.6/ 100
METRIC RATING
251st/ 347
METRIC RANK
$90,581
MEDIAN FAMILY INCOME
0.2/ 100
METRIC RATING
270th/ 347
METRIC RANK
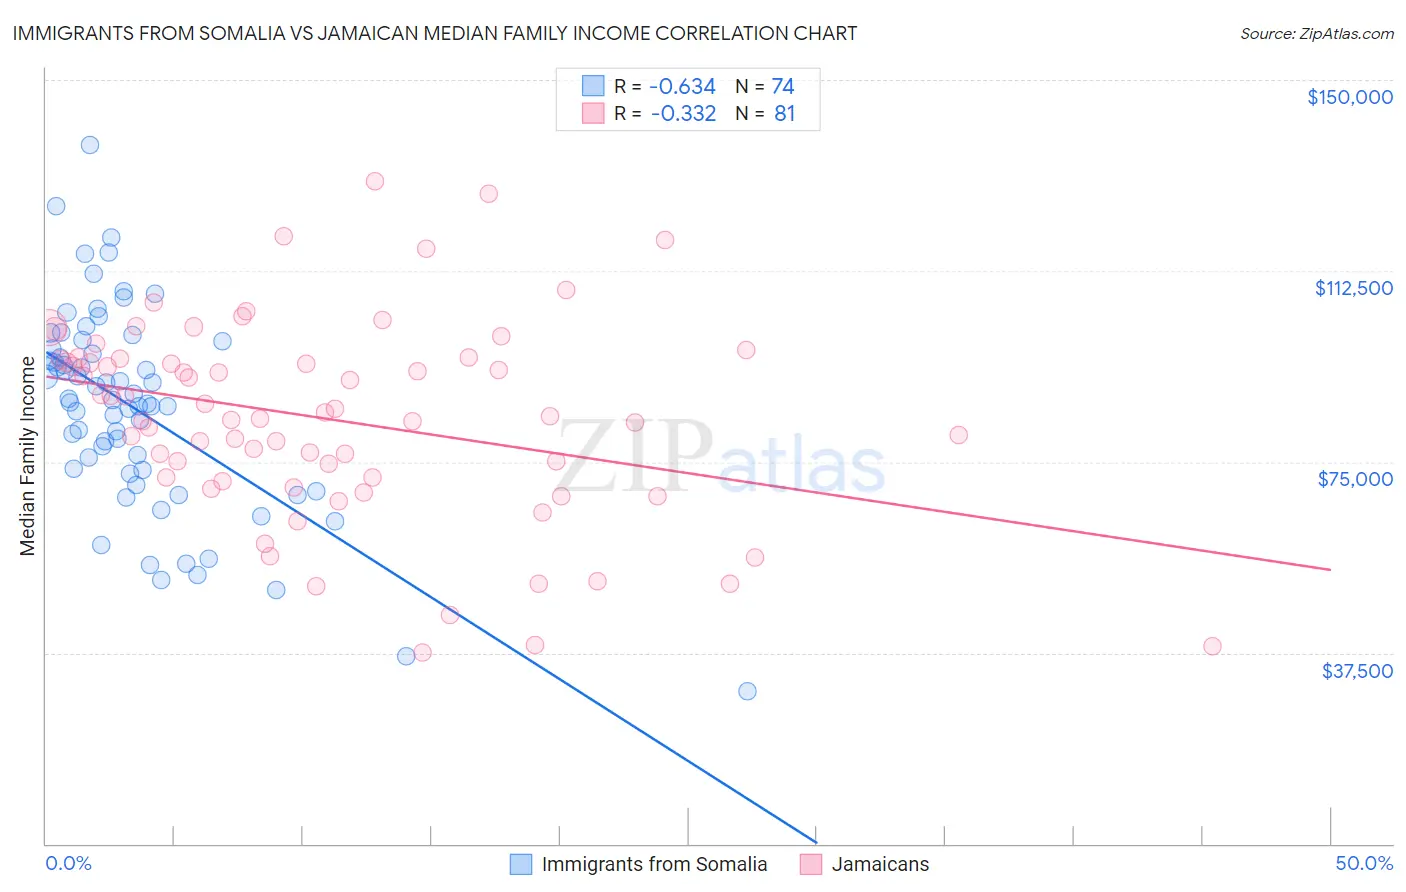
Immigrants from Somalia vs Jamaican Median Family Income Correlation Chart
The statistical analysis conducted on geographies consisting of 92,093,839 people shows a significant negative correlation between the proportion of Immigrants from Somalia and median family income in the United States with a correlation coefficient (R) of -0.634 and weighted average of $92,609. Similarly, the statistical analysis conducted on geographies consisting of 367,485,053 people shows a mild negative correlation between the proportion of Jamaicans and median family income in the United States with a correlation coefficient (R) of -0.332 and weighted average of $90,581, a difference of 2.2%.
Median Family Income Correlation Summary
| Measurement | Immigrants from Somalia | Jamaican |
| Minimum | $29,978 | $37,461 |
| Maximum | $137,115 | $130,066 |
| Range | $107,137 | $92,605 |
| Mean | $85,390 | $83,374 |
| Median | $86,897 | $84,019 |
| Interquartile 25% (IQ1) | $73,310 | $71,528 |
| Interquartile 75% (IQ3) | $97,167 | $95,163 |
| Interquartile Range (IQR) | $23,857 | $23,635 |
| Standard Deviation (Sample) | $19,854 | $19,598 |
| Standard Deviation (Population) | $19,720 | $19,477 |
Demographics Similar to Immigrants from Somalia and Jamaicans by Median Family Income
In terms of median family income, the demographic groups most similar to Immigrants from Somalia are Immigrants from El Salvador ($92,545, a difference of 0.070%), Immigrants from Guyana ($92,513, a difference of 0.10%), West Indian ($92,765, a difference of 0.17%), Immigrants from Barbados ($92,419, a difference of 0.21%), and Immigrants from Laos ($92,239, a difference of 0.40%). Similarly, the demographic groups most similar to Jamaicans are Cree ($90,882, a difference of 0.33%), Belizean ($90,880, a difference of 0.33%), Mexican American Indian ($90,918, a difference of 0.37%), Central American ($91,087, a difference of 0.56%), and Hmong ($91,296, a difference of 0.79%).
| Demographics | Rating | Rank | Median Family Income |
| West Indians | 0.6 /100 | #250 | Tragic $92,765 |
| Immigrants | Somalia | 0.6 /100 | #251 | Tragic $92,609 |
| Immigrants | El Salvador | 0.6 /100 | #252 | Tragic $92,545 |
| Immigrants | Guyana | 0.6 /100 | #253 | Tragic $92,513 |
| Immigrants | Barbados | 0.5 /100 | #254 | Tragic $92,419 |
| Immigrants | Laos | 0.5 /100 | #255 | Tragic $92,239 |
| Nicaraguans | 0.5 /100 | #256 | Tragic $92,231 |
| Americans | 0.4 /100 | #257 | Tragic $92,096 |
| Osage | 0.4 /100 | #258 | Tragic $91,926 |
| Cape Verdeans | 0.4 /100 | #259 | Tragic $91,848 |
| Pennsylvania Germans | 0.4 /100 | #260 | Tragic $91,763 |
| Inupiat | 0.4 /100 | #261 | Tragic $91,730 |
| Liberians | 0.4 /100 | #262 | Tragic $91,722 |
| Immigrants | West Indies | 0.3 /100 | #263 | Tragic $91,588 |
| Senegalese | 0.3 /100 | #264 | Tragic $91,475 |
| Hmong | 0.3 /100 | #265 | Tragic $91,296 |
| Central Americans | 0.3 /100 | #266 | Tragic $91,087 |
| Mexican American Indians | 0.2 /100 | #267 | Tragic $90,918 |
| Cree | 0.2 /100 | #268 | Tragic $90,882 |
| Belizeans | 0.2 /100 | #269 | Tragic $90,880 |
| Jamaicans | 0.2 /100 | #270 | Tragic $90,581 |