Basque vs Immigrants from Eastern Africa Householder Income Ages 25 - 44 years
COMPARE
Basque
Immigrants from Eastern Africa
Householder Income Ages 25 - 44 years
Householder Income Ages 25 - 44 years Comparison
Basques
Immigrants from Eastern Africa
$96,709
HOUSEHOLDER INCOME AGES 25 - 44 YEARS
76.6/ 100
METRIC RATING
149th/ 347
METRIC RANK
$91,458
HOUSEHOLDER INCOME AGES 25 - 44 YEARS
15.2/ 100
METRIC RATING
205th/ 347
METRIC RANK
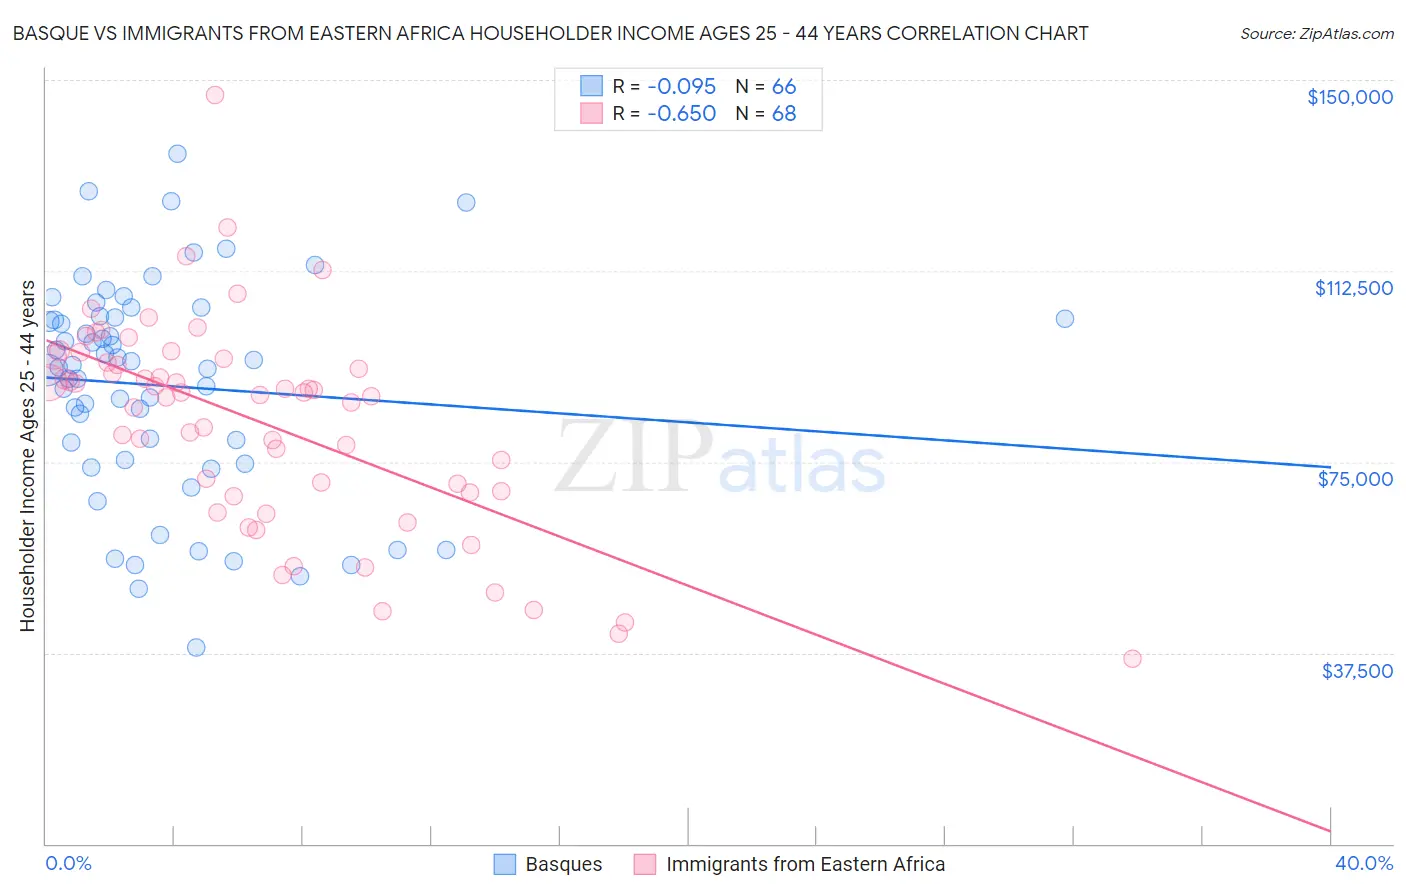
Basque vs Immigrants from Eastern Africa Householder Income Ages 25 - 44 years Correlation Chart
The statistical analysis conducted on geographies consisting of 165,637,052 people shows a slight negative correlation between the proportion of Basques and household income with householder between the ages 25 and 44 in the United States with a correlation coefficient (R) of -0.095 and weighted average of $96,709. Similarly, the statistical analysis conducted on geographies consisting of 354,447,145 people shows a significant negative correlation between the proportion of Immigrants from Eastern Africa and household income with householder between the ages 25 and 44 in the United States with a correlation coefficient (R) of -0.650 and weighted average of $91,458, a difference of 5.7%.
Householder Income Ages 25 - 44 years Correlation Summary
| Measurement | Basque | Immigrants from Eastern Africa |
| Minimum | $38,438 | $36,409 |
| Maximum | $135,625 | $146,936 |
| Range | $97,187 | $110,527 |
| Mean | $89,960 | $82,778 |
| Median | $93,797 | $88,339 |
| Interquartile 25% (IQ1) | $75,288 | $69,093 |
| Interquartile 75% (IQ3) | $103,321 | $94,875 |
| Interquartile Range (IQR) | $28,033 | $25,782 |
| Standard Deviation (Sample) | $21,216 | $20,521 |
| Standard Deviation (Population) | $21,055 | $20,370 |
Similar Demographics by Householder Income Ages 25 - 44 years
Demographics Similar to Basques by Householder Income Ages 25 - 44 years
In terms of householder income ages 25 - 44 years, the demographic groups most similar to Basques are Irish ($96,730, a difference of 0.020%), Ugandan ($96,667, a difference of 0.040%), Immigrants from Syria ($96,789, a difference of 0.080%), Ethiopian ($96,824, a difference of 0.12%), and Norwegian ($96,866, a difference of 0.16%).
| Demographics | Rating | Rank | Householder Income Ages 25 - 44 years |
| Danes | 81.3 /100 | #142 | Excellent $97,221 |
| Immigrants | Jordan | 81.0 /100 | #143 | Excellent $97,185 |
| Immigrants | Chile | 80.8 /100 | #144 | Excellent $97,159 |
| Norwegians | 78.2 /100 | #145 | Good $96,866 |
| Ethiopians | 77.8 /100 | #146 | Good $96,824 |
| Immigrants | Syria | 77.4 /100 | #147 | Good $96,789 |
| Irish | 76.9 /100 | #148 | Good $96,730 |
| Basques | 76.6 /100 | #149 | Good $96,709 |
| Ugandans | 76.2 /100 | #150 | Good $96,667 |
| Czechs | 74.8 /100 | #151 | Good $96,525 |
| South American Indians | 74.5 /100 | #152 | Good $96,497 |
| Slovenes | 73.9 /100 | #153 | Good $96,439 |
| Slavs | 73.2 /100 | #154 | Good $96,377 |
| Moroccans | 70.3 /100 | #155 | Good $96,117 |
| Immigrants | Germany | 67.9 /100 | #156 | Good $95,913 |
Demographics Similar to Immigrants from Eastern Africa by Householder Income Ages 25 - 44 years
In terms of householder income ages 25 - 44 years, the demographic groups most similar to Immigrants from Eastern Africa are Nepalese ($91,498, a difference of 0.040%), Immigrants from Cambodia ($91,533, a difference of 0.080%), Aleut ($91,370, a difference of 0.10%), Yugoslavian ($91,368, a difference of 0.10%), and Ecuadorian ($91,574, a difference of 0.13%).
| Demographics | Rating | Rank | Householder Income Ages 25 - 44 years |
| Vietnamese | 20.2 /100 | #198 | Fair $92,089 |
| Kenyans | 16.8 /100 | #199 | Poor $91,684 |
| Whites/Caucasians | 16.7 /100 | #200 | Poor $91,668 |
| Japanese | 16.4 /100 | #201 | Poor $91,624 |
| Ecuadorians | 16.0 /100 | #202 | Poor $91,574 |
| Immigrants | Cambodia | 15.7 /100 | #203 | Poor $91,533 |
| Nepalese | 15.4 /100 | #204 | Poor $91,498 |
| Immigrants | Eastern Africa | 15.2 /100 | #205 | Poor $91,458 |
| Aleuts | 14.5 /100 | #206 | Poor $91,370 |
| Yugoslavians | 14.5 /100 | #207 | Poor $91,368 |
| Immigrants | Thailand | 14.3 /100 | #208 | Poor $91,337 |
| Immigrants | Uruguay | 13.2 /100 | #209 | Poor $91,171 |
| Immigrants | Kenya | 10.9 /100 | #210 | Poor $90,767 |
| Iraqis | 10.8 /100 | #211 | Poor $90,764 |
| Hawaiians | 10.6 /100 | #212 | Poor $90,722 |