Immigrants from Kuwait vs Immigrants from Hungary Median Family Income
COMPARE
Immigrants from Kuwait
Immigrants from Hungary
Median Family Income
Median Family Income Comparison
Immigrants from Kuwait
Immigrants from Hungary
$109,731
MEDIAN FAMILY INCOME
97.4/ 100
METRIC RATING
98th/ 347
METRIC RANK
$111,378
MEDIAN FAMILY INCOME
98.8/ 100
METRIC RATING
84th/ 347
METRIC RANK
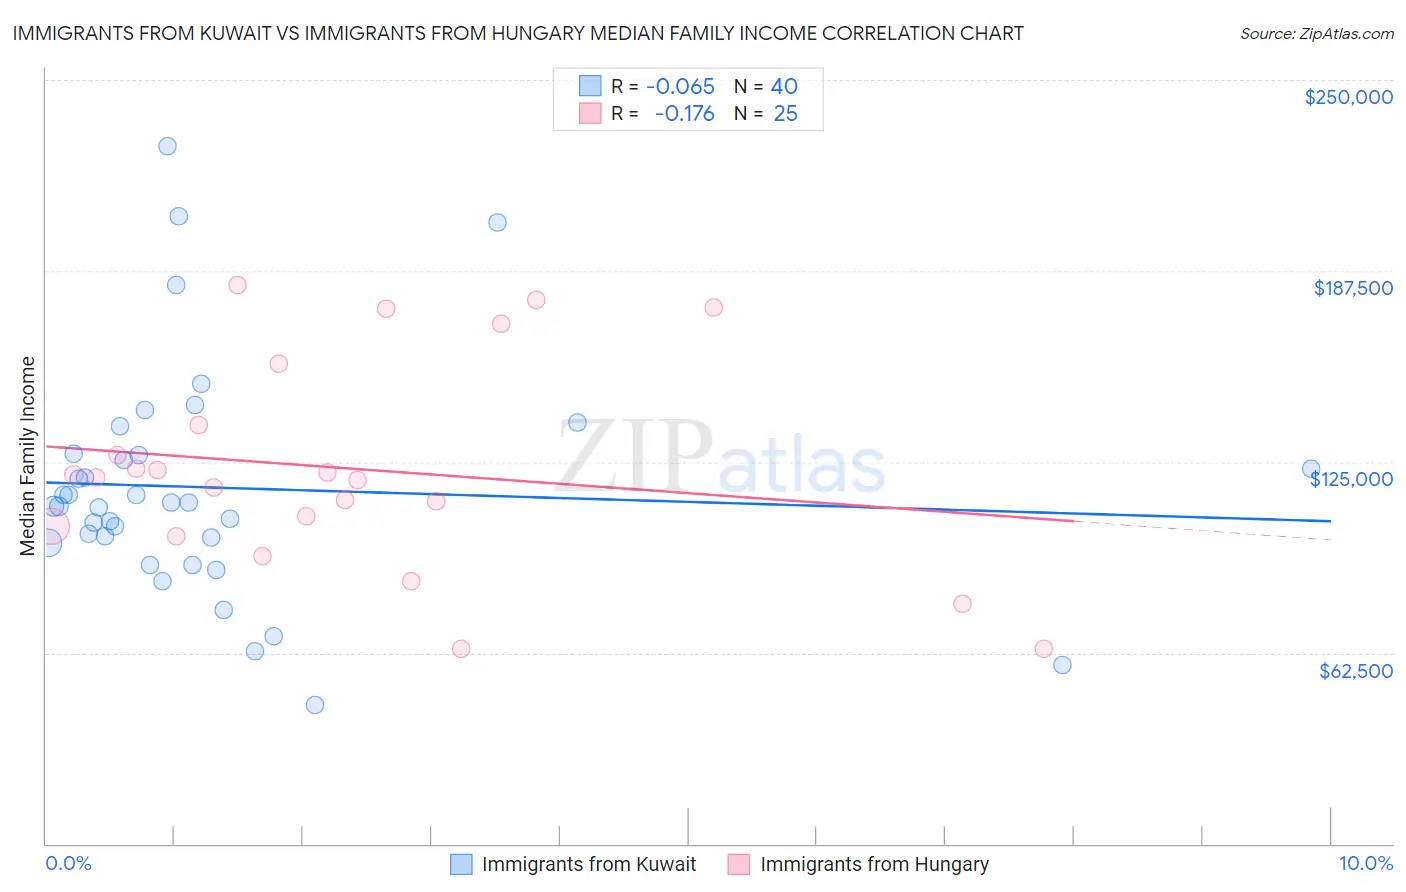
Immigrants from Kuwait vs Immigrants from Hungary Median Family Income Correlation Chart
The statistical analysis conducted on geographies consisting of 136,880,543 people shows a slight negative correlation between the proportion of Immigrants from Kuwait and median family income in the United States with a correlation coefficient (R) of -0.065 and weighted average of $109,731. Similarly, the statistical analysis conducted on geographies consisting of 195,642,900 people shows a poor negative correlation between the proportion of Immigrants from Hungary and median family income in the United States with a correlation coefficient (R) of -0.176 and weighted average of $111,378, a difference of 1.5%.
Median Family Income Correlation Summary
| Measurement | Immigrants from Kuwait | Immigrants from Hungary |
| Minimum | $45,469 | $63,750 |
| Maximum | $228,438 | $183,055 |
| Range | $182,969 | $119,305 |
| Mean | $116,543 | $122,792 |
| Median | $111,085 | $120,051 |
| Interquartile 25% (IQ1) | $99,414 | $102,275 |
| Interquartile 75% (IQ3) | $127,464 | $147,198 |
| Interquartile Range (IQR) | $28,050 | $44,923 |
| Standard Deviation (Sample) | $37,905 | $34,384 |
| Standard Deviation (Population) | $37,428 | $33,690 |
Demographics Similar to Immigrants from Kuwait and Immigrants from Hungary by Median Family Income
In terms of median family income, the demographic groups most similar to Immigrants from Kuwait are Armenian ($109,692, a difference of 0.040%), Macedonian ($109,668, a difference of 0.060%), Immigrants from Ukraine ($109,645, a difference of 0.080%), Jordanian ($109,865, a difference of 0.12%), and Immigrants from Moldova ($109,975, a difference of 0.22%). Similarly, the demographic groups most similar to Immigrants from Hungary are Croatian ($111,370, a difference of 0.010%), Ukrainian ($111,368, a difference of 0.010%), Austrian ($111,306, a difference of 0.060%), Romanian ($111,243, a difference of 0.12%), and Immigrants from Egypt ($111,689, a difference of 0.28%).
| Demographics | Rating | Rank | Median Family Income |
| Immigrants | North America | 99.2 /100 | #81 | Exceptional $112,151 |
| Immigrants | England | 99.2 /100 | #82 | Exceptional $112,038 |
| Immigrants | Egypt | 99.0 /100 | #83 | Exceptional $111,689 |
| Immigrants | Hungary | 98.8 /100 | #84 | Exceptional $111,378 |
| Croatians | 98.8 /100 | #85 | Exceptional $111,370 |
| Ukrainians | 98.8 /100 | #86 | Exceptional $111,368 |
| Austrians | 98.8 /100 | #87 | Exceptional $111,306 |
| Romanians | 98.8 /100 | #88 | Exceptional $111,243 |
| Immigrants | Argentina | 98.5 /100 | #89 | Exceptional $110,873 |
| Northern Europeans | 98.3 /100 | #90 | Exceptional $110,635 |
| Immigrants | Southern Europe | 98.3 /100 | #91 | Exceptional $110,614 |
| Immigrants | Lebanon | 97.9 /100 | #92 | Exceptional $110,159 |
| Immigrants | Kazakhstan | 97.8 /100 | #93 | Exceptional $110,137 |
| Koreans | 97.8 /100 | #94 | Exceptional $110,103 |
| Zimbabweans | 97.7 /100 | #95 | Exceptional $110,011 |
| Immigrants | Moldova | 97.7 /100 | #96 | Exceptional $109,975 |
| Jordanians | 97.5 /100 | #97 | Exceptional $109,865 |
| Immigrants | Kuwait | 97.4 /100 | #98 | Exceptional $109,731 |
| Armenians | 97.3 /100 | #99 | Exceptional $109,692 |
| Macedonians | 97.3 /100 | #100 | Exceptional $109,668 |
| Immigrants | Ukraine | 97.2 /100 | #101 | Exceptional $109,645 |