Immigrants from Middle Africa vs Lebanese Median Family Income
COMPARE
Immigrants from Middle Africa
Lebanese
Median Family Income
Median Family Income Comparison
Immigrants from Middle Africa
Lebanese
$93,593
MEDIAN FAMILY INCOME
1.0/ 100
METRIC RATING
245th/ 347
METRIC RANK
$107,086
MEDIAN FAMILY INCOME
90.5/ 100
METRIC RATING
127th/ 347
METRIC RANK
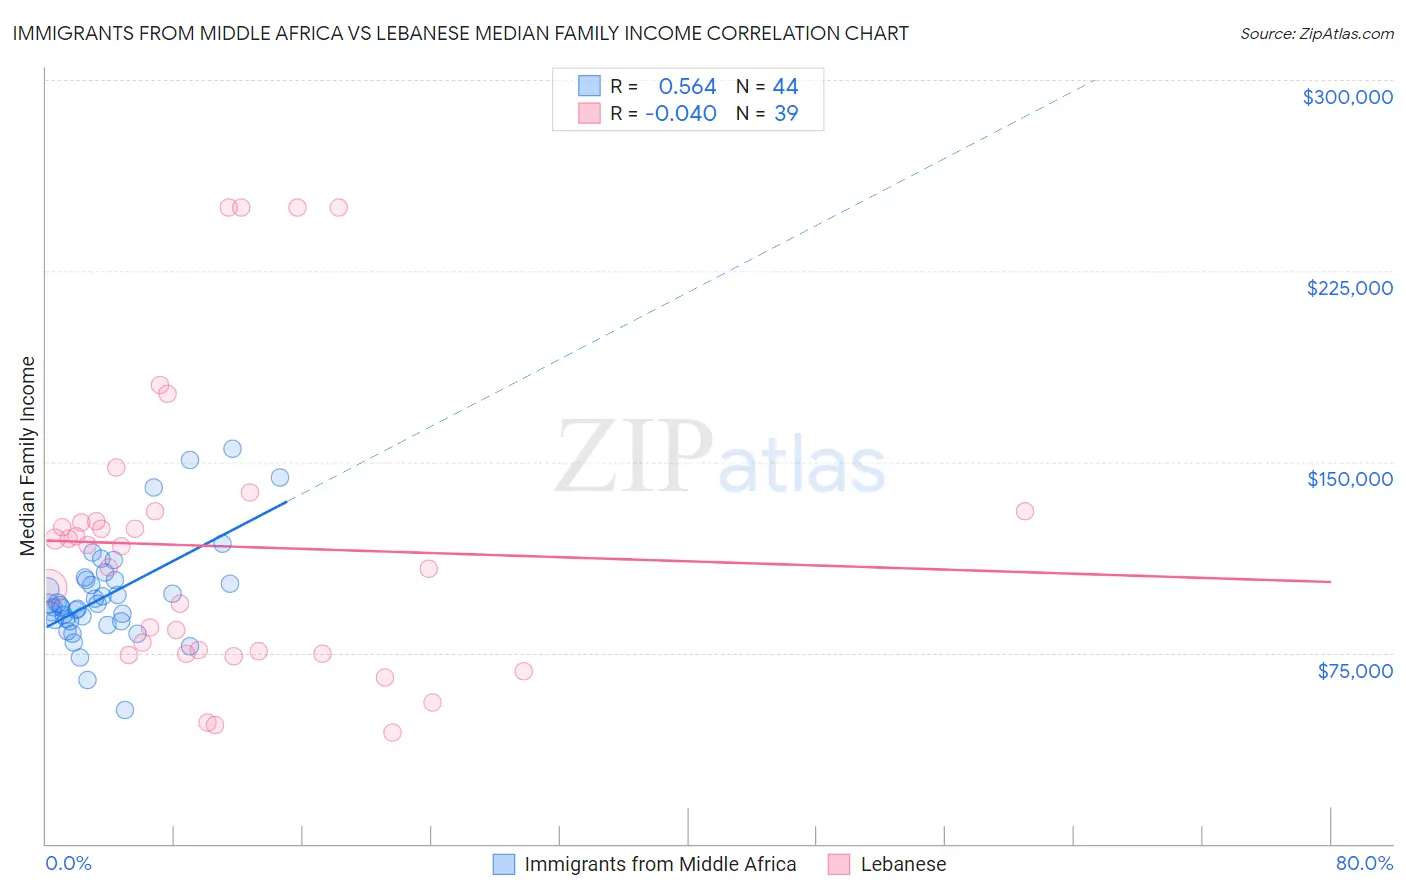
Immigrants from Middle Africa vs Lebanese Median Family Income Correlation Chart
The statistical analysis conducted on geographies consisting of 202,625,103 people shows a substantial positive correlation between the proportion of Immigrants from Middle Africa and median family income in the United States with a correlation coefficient (R) of 0.564 and weighted average of $93,593. Similarly, the statistical analysis conducted on geographies consisting of 401,188,092 people shows no correlation between the proportion of Lebanese and median family income in the United States with a correlation coefficient (R) of -0.040 and weighted average of $107,086, a difference of 14.4%.
Median Family Income Correlation Summary
| Measurement | Immigrants from Middle Africa | Lebanese |
| Minimum | $52,432 | $43,594 |
| Maximum | $155,375 | $250,001 |
| Range | $102,943 | $206,407 |
| Mean | $97,654 | $116,877 |
| Median | $93,999 | $116,743 |
| Interquartile 25% (IQ1) | $87,639 | $74,798 |
| Interquartile 75% (IQ3) | $103,622 | $130,372 |
| Interquartile Range (IQR) | $15,984 | $55,574 |
| Standard Deviation (Sample) | $20,164 | $56,099 |
| Standard Deviation (Population) | $19,934 | $55,375 |
Similar Demographics by Median Family Income
Demographics Similar to Immigrants from Middle Africa by Median Family Income
In terms of median family income, the demographic groups most similar to Immigrants from Middle Africa are Subsaharan African ($93,748, a difference of 0.17%), Guyanese ($93,373, a difference of 0.23%), German Russian ($93,858, a difference of 0.28%), Barbadian ($93,919, a difference of 0.35%), and Immigrants from Trinidad and Tobago ($93,988, a difference of 0.42%).
| Demographics | Rating | Rank | Median Family Income |
| Nepalese | 1.3 /100 | #238 | Tragic $94,153 |
| Salvadorans | 1.2 /100 | #239 | Tragic $94,109 |
| Somalis | 1.2 /100 | #240 | Tragic $94,085 |
| Immigrants | Trinidad and Tobago | 1.2 /100 | #241 | Tragic $93,988 |
| Barbadians | 1.1 /100 | #242 | Tragic $93,919 |
| German Russians | 1.1 /100 | #243 | Tragic $93,858 |
| Sub-Saharan Africans | 1.0 /100 | #244 | Tragic $93,748 |
| Immigrants | Middle Africa | 1.0 /100 | #245 | Tragic $93,593 |
| Guyanese | 0.9 /100 | #246 | Tragic $93,373 |
| Immigrants | Senegal | 0.7 /100 | #247 | Tragic $92,912 |
| French American Indians | 0.7 /100 | #248 | Tragic $92,872 |
| Immigrants | Ecuador | 0.7 /100 | #249 | Tragic $92,837 |
| West Indians | 0.6 /100 | #250 | Tragic $92,765 |
| Immigrants | Somalia | 0.6 /100 | #251 | Tragic $92,609 |
| Immigrants | El Salvador | 0.6 /100 | #252 | Tragic $92,545 |
Demographics Similar to Lebanese by Median Family Income
In terms of median family income, the demographic groups most similar to Lebanese are Serbian ($107,157, a difference of 0.070%), Immigrants from Ethiopia ($106,969, a difference of 0.11%), Arab ($106,952, a difference of 0.12%), Brazilian ($106,942, a difference of 0.13%), and Taiwanese ($107,295, a difference of 0.19%).
| Demographics | Rating | Rank | Median Family Income |
| Immigrants | Northern Africa | 94.3 /100 | #120 | Exceptional $108,161 |
| Europeans | 94.1 /100 | #121 | Exceptional $108,099 |
| Immigrants | Jordan | 92.9 /100 | #122 | Exceptional $107,715 |
| Carpatho Rusyns | 92.2 /100 | #123 | Exceptional $107,502 |
| Pakistanis | 91.7 /100 | #124 | Exceptional $107,390 |
| Taiwanese | 91.4 /100 | #125 | Exceptional $107,295 |
| Serbians | 90.8 /100 | #126 | Exceptional $107,157 |
| Lebanese | 90.5 /100 | #127 | Exceptional $107,086 |
| Immigrants | Ethiopia | 90.0 /100 | #128 | Excellent $106,969 |
| Arabs | 89.9 /100 | #129 | Excellent $106,952 |
| Brazilians | 89.8 /100 | #130 | Excellent $106,942 |
| Canadians | 88.1 /100 | #131 | Excellent $106,597 |
| Immigrants | Fiji | 87.8 /100 | #132 | Excellent $106,544 |
| Ugandans | 87.8 /100 | #133 | Excellent $106,541 |
| Immigrants | Oceania | 87.3 /100 | #134 | Excellent $106,453 |